2026 Data Stack Overview
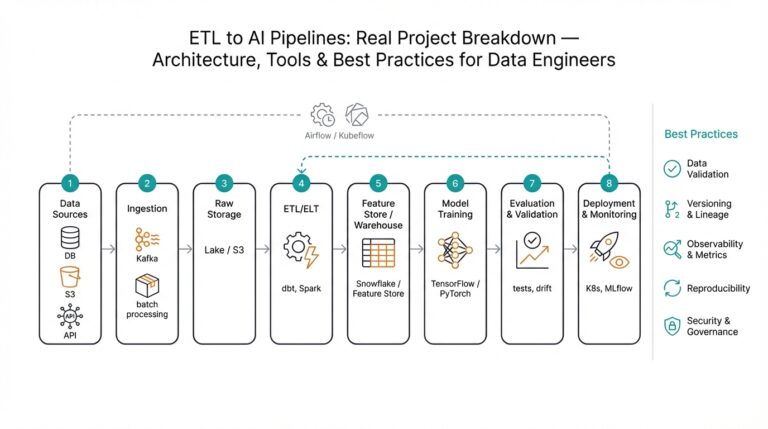
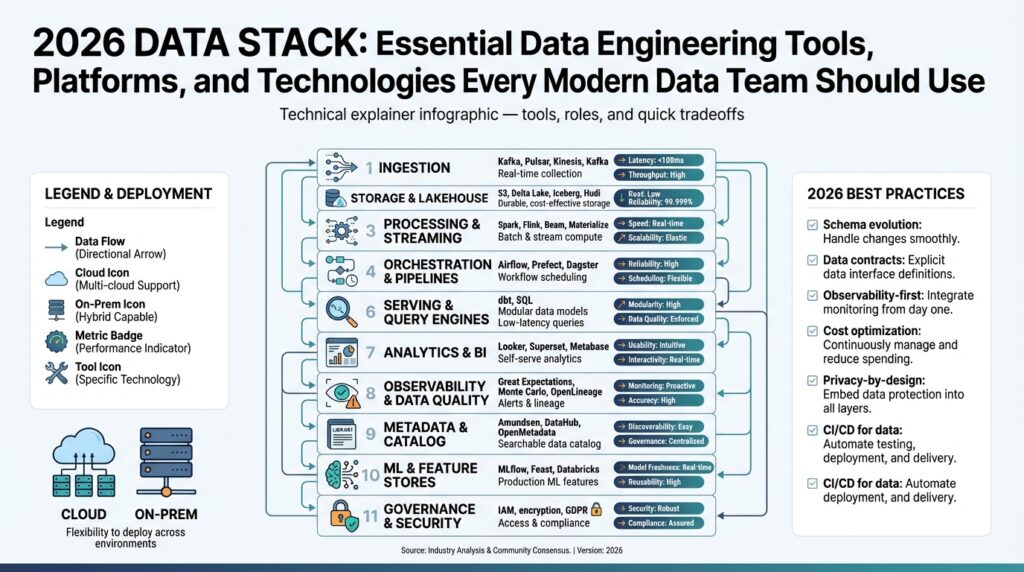
Building on the foundation you’ve already read, the 2026 data stack centers on a few converging ideas: open lakehouse storage, SQL-first transformation, real-time stream-batch unification, and active metadata for governance. In practice that means teams replace brittle two-tier architectures with a single object-storage-backed system that supports ACID, time travel, and both analytic and ML workloads—what vendors and communities now call the lakehouse or lakehouse pattern. This consolidation shapes how we design ingestion, processing, and serving layers across the whole platform. (databricks.com)
Start by thinking in logical layers rather than vendor silos: ingestion and CDC for low-latency capture, a durable lakehouse for raw and curated tables, a transformation layer that treats SQL as code, a stream-and-batch compute layer for freshness, and an active metadata/observability plane that ties it together. The stream-batch unification trend is real: modern engines have moved beyond micro-batch to materialized views and long-running SQL tables that blur the line between streaming and batch processing, enabling sub-second freshness for many use cases. When should you pick a lakehouse over a dedicated data warehouse? Choose the lakehouse when you need open formats, large-scale ML datasets, or unified batch+stream semantics; prefer a warehouse when you prioritize managed BI performance and extremely simple operational models. (flink.apache.org)
For ingestion and near-real-time capture, log-based CDC and message buses remain central because they turn transactional changes into replayable event streams that feed both operational and analytical consumers. In live systems we typically pair Debezium-style CDC with a cloud message layer or native ingestion to the lakehouse so downstream engines can consume consistent change streams without adding load to OLTP systems. This pattern supports event-driven microservices, real-time analytics, and more accurate incremental transforms while preserving the ability to replay and reprocess historical events. (github.com)
Transformation and the developer experience shifted decisively to SQL-first engineering: dbt-style analytics engineering is the lingua franca for models, tests, and lineage, and platform vendors are embedding transformation engines closer to storage to reduce movement and cost. We now regularly see teams using version-controlled SQL with automated testing, docs-driven lineage, and CI/CD pipelines to ship curated datasets as productized assets—reducing firefights when downstream reports or models break. If you’re evaluating tooling, prioritize systems that give you reproducible builds, robust testing, and integration with your catalog and CI workflows. (prnewswire.com)
Observability and active metadata are no longer optional: data quality platforms, lineage standards, and metadata graphs provide the context needed for debugging, compliance, and automated remediation. Production data platforms use OpenLineage-style events and metadata graphs so alerts and diagnostics can find the root cause quickly, while data-observability vendors are adding ML/GenAI assists to suggest validation rules or triage incidents. In practice, this means faster incident resolution and fewer “unknown upstream changes” that used to knock analytics pipelines out of service. (montecarlodata.com)
Putting it together, architects should evaluate candidate stacks against three practical axes: data freshness requirements, cost model (storage vs compute), and operational ownership (central platform vs domain teams). For example, a payments team that needs sub-second fraud signals should design for CDC + stream processing + materialized serving tables, whereas a finance analytics domain may optimize for cost and governance with a curated lakehouse and scheduled dbt transformations. Taking this concept further, the next sections will map these decisions to concrete tool choices and operational patterns that help you turn the architectural intent into runnable, testable pipelines.
Ingestion and CDC Connectors
Building on this foundation, reliable ingestion and robust CDC (Change Data Capture) connectors are the glue that keep transactional systems and your lakehouse synchronized. Ingestion and CDC should be treated as first-class engineering problems: they determine freshness, replayability, and the operational surface area for downstream analytics and ML. Early decisions about connector topology, transport, and schema handling shape whether you can achieve sub-second insights or be stuck with slow, brittle pipelines.
Start by picking the right capture model: log-based CDC versus polling or bulk snapshots. Log-based CDC reads the database write-ahead log (WAL) and emits immutable change events that preserve ordering and transactional boundaries, which reduces load on OLTP systems and enables replay. Polling and periodic full snapshots still have a place for legacy stores or systems without logical logs, but they force you to manage watermarking, deduplication, and higher latency. In practice we usually pair a log-based CDC connector with a message bus or native lakehouse ingestion so you can decouple producers from multiple consumers.
Connector choice is more than a vendor decision; it’s an API and contract design problem. A connector must deliver consistent offsets, handle schema evolution, and provide snapshot-to-stream handoff without gaps. For example, a Debezium-style connector handles initial table snapshots and then streams binlog changes with per-table offsets, while native cloud ingestion services might optimize throughput but limit fine-grained control. When you design pipelines, plan for schema drift: publish schema metadata with every event, validate changes in a staging tier, and implement automated migrations that preserve backward compatibility for downstream models.
Operationalizing CDC requires thinking about throughput, backpressure, and idempotency as core features, not afterthoughts. You’ll face bursts from bulk loads or schema changes, so choose connectors and message layers that support partitioning and consumer-side flow control; otherwise retries can amplify load and cause cascading failures. Exactly-once guarantees are useful but expensive—prefer idempotent consumers and deterministic upserts in the lakehouse to get practical end-to-end semantics. Monitor connector lag, failed offset commits, and snapshot progress, and surface those metrics into your active metadata plane so teams can triage quickly when upstream systems change.
We often demonstrate this with a minimal pattern rather than a large config blob: run a log-based connector that emits canonicalized change events (operation, before, after, ts, schema) into a partitioned topic on a message bus; run a stream ingestion job that consumes the topic, applies idempotent upserts to your lakehouse table, and records lineage and offsets back to the metadata store. For example, your change event should include a stable primary key and a monotonic ordering token so your downstream upsert logic can safely deduplicate. That simple pattern gives you replayability—reprocess a topic to rebuild derived tables—and helps you recover from logical errors without touching the source database.
When should you pick CDC over periodic batch ingestion? Choose CDC when you need low-latency analytics, real-time feature stores, or event-driven microservices that react to business events. Opt for scheduled bulk loads when data freshness requirements are relaxed and cost predictability matters, such as daily financial reconciliations. In many production stacks we mix both: CDC for hot OLTP-to-stream flows and efficient bulk ingestion for historical backfills and large enrichments.
Taking this concept further, integrate connectors with your transformation and observability layers so change events carry lineage and schema annotations into your SQL-first workflows. That enables automated tests, CI-driven deployments of transformations, and faster debugging when a schema change breaks a model. In the next section we’ll explore how transformation engines consume these upserts and materialized views to deliver the freshness guarantees your consumers expect.
Warehouses and Lakehouses
Deciding how to serve analytical and ML workloads is one of the first architecture choices you make after stabilizing ingestion and CDC. If you think in terms of capabilities rather than product names, the trade is straightforward: choose a managed, query-optimized data warehouse when you need predictable BI performance and minimal operational surface; choose an object-storage-backed lakehouse when you need open formats, large-scale feature datasets, and unified stream-plus-batch semantics. Because we favor a SQL-first engineering workflow, your selection should also consider how transformations, tests, and CI/CD integrate with the storage and compute model you pick.
At a technical level the two approaches diverge on storage, semantics, and compute elasticity. A lakehouse stores data in open columnar formats on object storage and layers ACID transactions and time-travel semantics on top of that storage; this enables large, versioned datasets for ML, reproducible backfills, and cost-efficient long-term retention. A data warehouse typically optimizes for low-latency ad-hoc queries, fine-grained concurrency, and managed resources that hide compaction and file management from you, which reduces ops but increases vendor lock-in and storage cost. Materialized views and long-running SQL tables blur the operational differences today, but they behave differently under heavy update rates and unbounded streams.
When should you pick a lakehouse over a dedicated data warehouse? Choose the lakehouse if you must store petabyte-scale raw data, run ML training on full-history datasets, or require open file formats for multi-tool interoperability; choose the data warehouse if your primary consumers are BI dashboards and you need sub-second concurrency without managing compaction or small-file tuning. For example, a fraud-detection team that needs feature joins across event history plus streaming updates benefits from a lakehouse fed by CDC; a finance team that runs high-concurrency reporting over curated, slowly changing tables may be happier with a managed data warehouse. These aren’t mutually exclusive: many production platforms use a lakehouse as the canonical store and a high-performance warehouse for the serving layer.
Operationally, we implement the hybrid pattern by applying CDC to feed canonical tables in the lakehouse and then providing curated, denormalized snapshots to the warehouse for serving. The critical upsert pattern looks the same across vendors: consume change events with a stable primary key and ordering token, then run idempotent MERGE/UPSERT logic against the target table. A minimal example in SQL-style pseudocode is useful because it generalizes:
MERGE INTO target_table AS t
USING (SELECT pk, payload, event_ts FROM staging_events) AS s
ON t.pk = s.pk
WHEN MATCHED AND s.event_ts > t.last_seen_ts THEN
  UPDATE SET t.payload = s.payload, t.last_seen_ts = s.event_ts
WHEN NOT MATCHED THEN
  INSERT (pk, payload, last_seen_ts) VALUES (s.pk, s.payload, s.event_ts);
Design toward pragmatic compaction and partitioning: keep files in the optimal size range for your engine, co-locate columns you query together using clustering or z-order techniques, and partition by high-cardinality time buckets when queries are time-bounded. These tuning knobs reduce read amplification on both lakehouse and warehouse reads and make materialized views and CDC-driven upserts far more efficient. Monitor file counts, read amplification, and small-file churn as first-class SLOs to avoid surprise compute costs.
Governance and observability shape which architecture scales across teams. Integrate active metadata so every CDC stream, transform, and materialized view carries lineage and schema annotations; that lets you run automated schema tests, roll back problematic changes with time-travel, and audit data lineage for compliance. Practically, enforce schema validations in a staging tier, emit OpenLineage-style events from your SQL-first transformations, and wire those events into alerting so teams can triage upstream schema drift before it breaks downstream models.
Taking these practices together, you can treat the lakehouse and the data warehouse as complementary tiers rather than opposing choices. Design your pipelines so the lakehouse is the durable canonical source for historical and ML workloads while the warehouse provides a tuned serving layer for interactive analytics; the transformation layer then materializes the glue between them using tested, version-controlled SQL we can deploy safely. In the next section we’ll explore how transformation engines and CI workflows operationalize those materialized artifacts and enforce the contracts that keep both tiers healthy.
Transformations with dbt
dbt and SQL-first transformations are the control plane that turns raw, CDC-fed lakehouse tables into trusted, productized datasets—so front-load that idea: treat transformations as version-controlled software with tests, docs, and CI/CD. In the modern lakehouse-driven data stack we discussed earlier, dbt becomes the place where schema contracts, business logic, and lineage converge; you author models in SQL, enforce tests, and emit metadata that ties back to ingestion and observability. This approach reduces firefights when upstream schema changes arrive and makes curated datasets repeatable and auditable for both analytics and ML teams.
Start by thinking of dbt models as layered software artifacts: staging models normalize raw CDC payloads, intermediate models implement business logic, and marts expose denormalized, query-optimized tables. We recommend capturing canonical keys and monotonic ordering tokens during ingestion so your dbt incremental models can apply deterministic MERGE semantics against the lakehouse. When should you use dbt snapshots versus incremental models? Use snapshots for slowly-changing historical state where you need full version history; use incremental models when you can idempotently upsert current state to meet freshness SLAs.
Practical patterns matter. Implement a staging layer that canonicalizes column names, flattens nested payloads, and emits a stable primary key plus event_ts; then build incremental feature or reporting tables from those stage models. For deterministic upserts, use a dbt model configured for incremental materialization and push a MERGE statement to your engine. For example, a minimal dbt incremental pattern looks like this:
{{ config(materialized='incremental', unique_key='pk') }}

WITH src AS (
  SELECT pk, payload, event_ts
  FROM {{ ref('staging_events') }}
  WHERE event_ts > (SELECT COALESCE(MAX(last_seen_ts), '1970-01-01') FROM {{ this }})
)

MERGE INTO {{ this }} t
USING src s
ON t.pk = s.pk
WHEN MATCHED AND s.event_ts > t.last_seen_ts THEN
  UPDATE SET payload = s.payload, last_seen_ts = s.event_ts
WHEN NOT MATCHED THEN
  INSERT (pk, payload, last_seen_ts) VALUES (s.pk, s.payload, s.event_ts);
How do you handle schema drift and broken assumptions? Treat dbt tests and CI as your first line of defense: run schema, uniqueness, and custom business tests in every pull request, fail builds on breaking changes, and require staged deployments for schema-altering merges. Integrate dbt docs and lineage into your active metadata plane so alerts about a failing test point to the exact upstream change in the CDC stream; this closes the loop between ingestion, transformation, and observability and speeds incident resolution.
Performance and cost tuning live in materialization choices and low-level file/layout decisions. Use ephemeral models for short-lived transformations to reduce intermediate storage and leverage table or incremental materializations for heavy reuse; choose clustering/partitioning strategies that align with your dominant query patterns to reduce read amplification. In a lakehouse, monitor small-file churn, compaction lag, and read amplification as SLOs—dbt alone doesn’t solve compaction, but authoring deterministic, partition-pruning-friendly SQL makes compaction and compaction scheduling far more effective.
To make this concrete, imagine a payments team: CDC streams populate canonical event tables in the lakehouse, dbt staging models canonicalize and validate schema, incremental dbt models maintain current customer-state and feature tables for fraud scoring, and a scheduled job builds denormalized snapshots for the BI warehouse. We deploy all of this through CI/CD pipelines that run lint, unit tests, and full model builds against a transient environment before applying to prod. Taking this approach, we get reproducible builds, auditable lineage, and the operational confidence to ship transformations as first-class product artifacts—next we’ll translate these artifacts into serving patterns and automated observability workflows.
Orchestration and Workflow Engines
Orchestration and the modern workflow engine are the control plane that turns discrete jobs into reliable, testable data products. We treat orchestration as more than scheduling: it coordinates retries, enables deterministic backfills, and enforces data contracts across CDC, transformation, and serving layers. If a downstream SLA requires sub-minute freshness, your orchestration must support event-triggered runs, concurrency controls, and deterministic idempotent tasks so you can replay without corrupting state. Think of the engine as the guardian of pipeline correctness and deployability rather than a simple cron replacement.
Build your approach around two core patterns: schedule-driven DAGs for predictable reporting workloads and event-driven runs for low-latency CDC-driven flows. When should you choose event-driven versus schedule-driven orchestration? Choose event-driven when freshness and replayability matter—fraud signals, feature stores, or streaming materialized views—and schedule-driven for cost-predictable, daily aggregates where tight windows and batching make sense. In practice we use hybrid pipelines: an event-sourced upsert stream feeds canonical tables while scheduled DAGs run heavier, deterministic dbt builds that denormalize and snapshot for BI.
When evaluating a workflow engine, focus on three capabilities: expressive dependency graphs and typed interfaces, robust local testing and CI hooks, and deep observability integration that surfaces lineage, runtimes, and failures. We prefer engines that let you define tasks as composable units with clear idempotency guarantees, run them in containers on Kubernetes or managed runners, and emit OpenLineage-style events so the active metadata plane can trigger alerts and automated rollbacks. You should also prefer engines that make it easy to run DAGs locally and to run unit tests against small, mocked datasets so you catch schema drift before it hits production.
Make your pipeline code deterministic. For example, a minimal pseudo-DAG shows the shape we use in production:
with DAG('payments_pipeline') as dag:
    wait_cdc = Sensor('cdc_topic_ready')
    stage = Task('staging_upsert', idempotent=True)
    validate = Task('schema_tests')
    transform = Task('dbt_run', depends_on_past=False)
    compact = Task('table_compaction')

    wait_cdc >> stage >> validate >> transform >> compact
This layout enforces that staging is idempotent, validation gates prevent broken schemas from advancing, and compaction runs after transformations to manage small-file churn. Writing tasks as small, well-scoped units makes retries safe and backfills predictable; it also lets you parallelize non-dependent steps and keep SLOs tight without wasting compute.
Operational practices decide whether orchestration scales or becomes technical debt. We register DAGs in version control, run CI that lints and unit-tests tasks, apply staged deployments with canary runs against a subset of tenants, and enforce runtime SLAs with alerting and automated incident playbooks. Integrate your workflow engine with the active metadata graph so a failing schema test points directly to the CDC stream and the failing dbt model; that linkage shortens MTTI and avoids the classic “unknown upstream change” firefight.
Taking this concept further, treat orchestration as the glue between transformations and observability: the engine should not only execute tasks but emit lineage, timing, and resource metadata that your monitoring and governance layers can act on. As we discussed earlier, combining deterministic dbt models, reliable CDC, and an instrumentation-rich workflow engine gives you reproducible builds, safe rollbacks, and the operational visibility needed to scale data teams. Next, we’ll look at how observability and active metadata operationalize those guarantees across an organization.
Monitoring, Observability, Governance
Building on this foundation, treat monitoring, observability, and governance as a single control plane for data reliability rather than three separate functions. If you instrument only job runtimes or only data quality checks, you’ll miss the chains of causality that make incidents noisy and slow to resolve. We recommend defining SLOs for freshness, correctness, and availability up front, then ensuring every pipeline emits metrics, traces, and lineage that map directly to those SLOs so alerts point to remediation steps, not just failures.
Start with a clear telemetry taxonomy: metrics for health (lag, success rate, file counts), traces for execution paths (CDC -> ingestion -> transform -> upsert), and logs for context (schema errors, exception stacks). This separation lets you answer different operational questions quickly: metrics tell you that something broke, traces show where it broke in the DAG, and logs provide the error details necessary to fix it. Define SLOs and SLIs for each critical dataset—freshness window, percent of processed events, and schema conformance—and treat those SLIs as testable, monitored contracts that drive alert thresholds.
Active metadata and lineage are the connective tissue between observability and governance. Rather than sending isolated alerts, emit OpenLineage-style events or similar metadata every time a CDC snapshot, dbt build, or materialized view runs so the metadata graph can locate upstream producers and downstream consumers automatically. When a schema drift alert fires, the graph should show which models, dashboards, and ML features will be impacted so you can scope a rollback or staged migration. This lineage-first approach reduces mean time to identification (MTTI) and makes governance decisions—like quarantining a dataset or notifying data owners—automatable.
How do you instrument pipelines to detect schema drift early? Include lightweight schema hashes and sample-row diffs with your transformation metadata. For example, augment your pipeline end-of-run event with a JSON payload containing a schema fingerprint, row count, and a short diff; store that alongside your lineage events so your observability plane can compare expected versus observed schemas. A minimal event might look like this:
{
  "dataset": "payments.canonical_events",
  "run_id": "2026-01-24T12:34:56Z",
  "schema_fingerprint": "sha256:abc123",
  "row_count": 4321,
  "diff": [{"column":"amount","type_change":"int->float"}]
}
Instrumenting like this makes automated triage possible: an alert rule can correlate a schema change with failing downstream tests, create a ticket, and notify the owning team with both the diff and the impacted lineage graph. That same metadata payload should feed your monitoring dashboard so you can pivot from a failing SLI to the exact CDC stream offset and transformation job in one click.
Governance belongs in CI/CD and runtime enforcement, not in one-off spreadsheets. Implement policy-as-code for access controls, retention, and masking, and validate policies in PR pipelines before schema or model changes reach production. Enforce least-privilege via role-based access controls and column-level masking for sensitive fields; record every access in immutable audit logs tied to your metadata graph so audits become queries against a system, not months of manual reconciliation. Use automated data quality gates—tests that fail the CI job and block deployment—so governance becomes a fast feedback loop rather than a late-stage review.
Operationalize incident playbooks that combine observability signals with governance actions: when a data-quality SLO breaches, automatically quarantine the affected dataset, trigger a backfill job against a time-travel snapshot, and notify downstream service owners with a remediation checklist derived from the lineage graph. We should build runbooks that reference concrete offsets, artifacts, and deterministic upsert logic so rollbacks are reproducible and testable. Taking this approach, monitoring becomes the trigger, observability the diagnosis, and governance the enforced remediation—creating a tightly-coupled lifecycle that scales across teams and reduces firefights as the platform grows.
Next, we will translate these signals into automated remediation workflows and policy enforcement that close the loop between detection and repair, giving teams the confidence to ship changes while preserving data reliability and compliance.