Measure Query Performance
Accurate measurement starts with repeatable, objective metrics: wall‑clock (elapsed) time, CPU time, logical and physical reads, rows processed, execution count, and wait/lock events. Capture both the execution plan and runtime statistics so you can compare estimated vs actual costs and spot plan changes. Run queries multiple times to separate cold‑cache (first run) from warm‑cache behavior and report central tendencies (median) plus tail latency (p95/p99) rather than just averages.
Instrument both the query and the host: collect database profiler output and system counters (CPU, disk I/O, memory, network). Use explain-style tools to see operator costs and buffer usage (for example, in PostgreSQL: EXPLAIN (ANALYZE, BUFFERS) <query>;, in MySQL 8+: EXPLAIN ANALYZE <query>;). Aggregate long‑running workload stats with the DB’s telemetry features (pg_stat_statements, Query Store, performance_schema) to find hot queries and regressions over time.
Adopt a baseline and automated regression checks: snapshot performance before changes, run A/B comparisons, and record execution plans. When interpreting results, follow the signal: high logical reads imply scan/indexing issues, high CPU suggests expensive expressions or large join work, and high wait times point to contention or I/O bottlenecks. Use controlled synthetic loads for concurrency testing, capture plans for offending runs, and iterate: reduce row counts early, add/selective indexes, rewrite joins, or adjust configuration based on measured bottlenecks.
Read Execution Plans
Execution plans are the map the optimizer builds—scan and join operators, access methods, estimated costs and, when available, actual runtime metrics. Start by identifying the few operators that contribute most cost or I/O; these are the places to fix. Compare estimated rows versus actual rows: large disparities point to cardinality errors (stale or missing statistics, data skew, or non‑SARGable predicates) and are the most common root cause of bad plans. Check access patterns: index seek vs index/sequence scan, and whether predicates are applied early (predicate pushdown) or after expensive operators. Inspect join algorithms—nested loop, hash, merge—and confirm they match expected input sizes; nested loops over large inputs often indicate a missing index. Watch for sorts and spills (memory grant exceeded), which signal insufficient memory or inefficient plans that may be alleviated by better indexing or rewritten queries. Parallelism nodes reveal whether the optimizer chose distribution; excessive coordination or skew can hurt throughput. Use explain with runtime output to capture real behavior (for example, EXPLAIN (ANALYZE, BUFFERS) in PostgreSQL or EXPLAIN ANALYZE in MySQL 8+) and save plan artifacts (text, XML, or JSON) for comparison across runs. When a plan looks wrong, first refresh statistics and test rewrites (refine predicates, reduce row estimates early, add covering indexes). Only after measurement consider hints or plan forcing, and always validate changes under both cold and warm cache conditions to avoid regressions.
Indexing Strategies
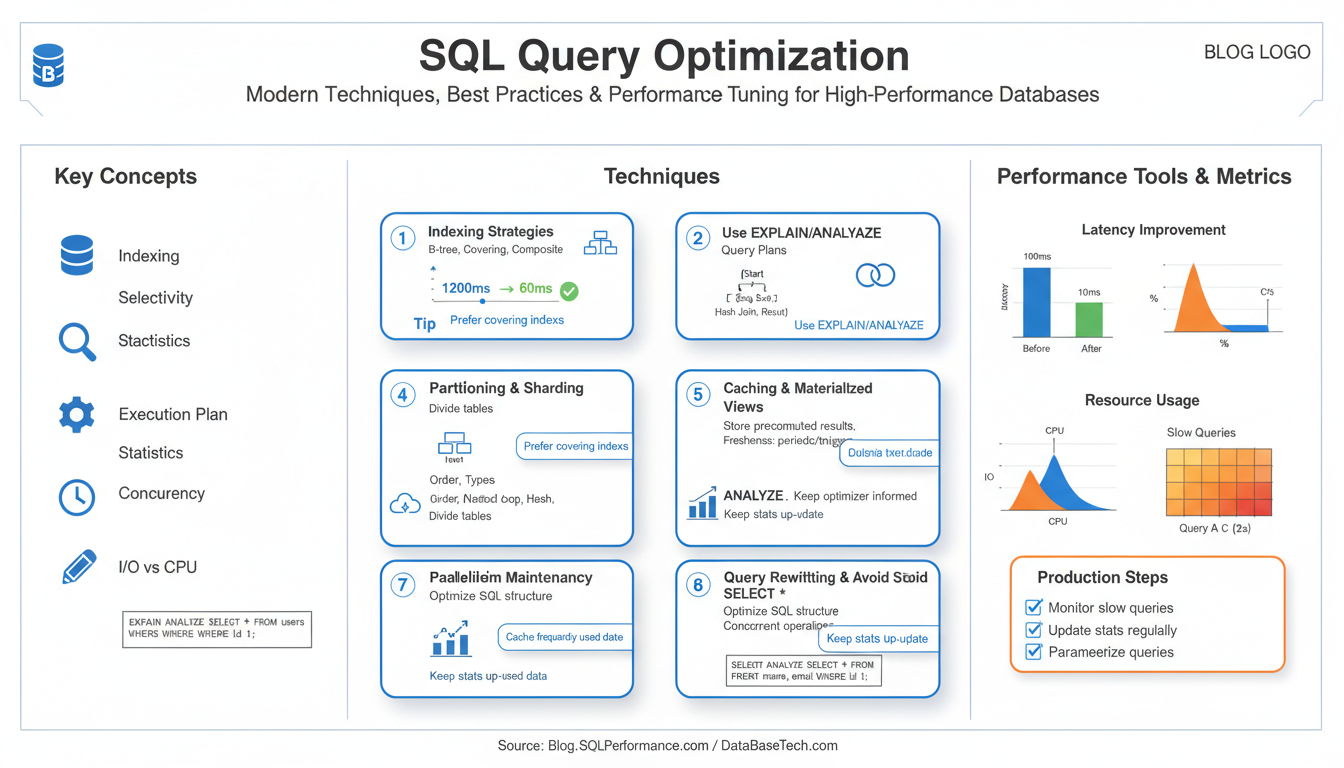
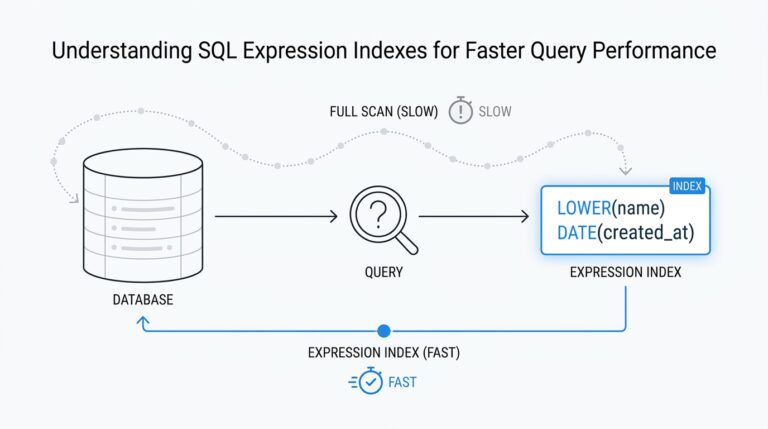
Index selection should be driven by measured hotspots and execution plans: add an index only when it reduces the dominant cost (logical reads, expensive joins, or repeated full scans). Favor a small set of targeted indexes that support frequent WHERE predicates and join keys; too many indexes harm INSERT/UPDATE/DELETE throughput and increase maintenance overhead. Use composite indexes when queries filter or join on multiple columns—place the most selective and commonly filtered column first to maximize the left‑prefix effect—and add non‑key INCLUDE columns to create covering indexes that eliminate lookups without bloating search keys.
Prefer the right index type for the data and workload: B‑tree variants suit equality and range queries, GiST/GIN or inverted indexes fit full‑text, JSON or array searches, and BRIN indexes are excellent for very large, naturally clustered data (time series) with low per‑page cardinality. Avoid indexing low‑cardinality columns unless combined with other selective predicates or used in filtered/partial indexes.
Maintain statistics and index health: keep histograms up to date, monitor index usage, and schedule rebuilds/reorganizations and appropriate fillfactor to reduce fragmentation or bloat. Validate every index change by comparing execution plans and runtime metrics under cold and warm cache runs, and weigh read latency gains against write and storage costs before committing schema changes.
Efficient Joins and Access Patterns
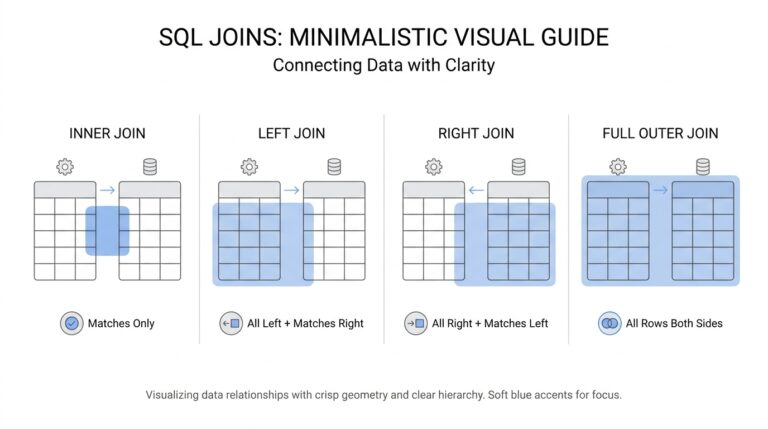
Start by letting the optimizer do heavy lifting: ensure accurate statistics and selective indexes on join keys so the planner can choose hash/merge vs nested loop appropriately. Rewrite predicates to filter rows as early as possible—apply WHERE clauses and sargable expressions before joins or in subqueries so downstream join inputs are smaller. Prefer equi-joins on indexed columns for nested-loop-friendly lookups; for large, unsorted inputs, hash joins are usually cheaper, while merge joins outperform when inputs are naturally ordered or when you can leverage index order.
Avoid unnecessary columns and wide SELECT * patterns; projecting only required columns reduces memory and I/O during join processing. Use covering indexes (include non-key columns) to eliminate lookups for frequent join+filter patterns. When joining many-to-many or highly skewed datasets, check cardinality estimates: large estimated/actual disparities often mean stale statistics or data skew—run ANALYZE/UPDATE STATISTICS and consider multi-column stats or histograms for correlated columns.
Consider query rewrites: replace IN with EXISTS for correlated subqueries when appropriate, pre-aggregate large tables before joining to shrink intermediate sets, and push LIMIT/OFFSET early when logical. Materialize repeated subexpressions with temporary tables or materialized CTEs when a costly subquery feeds multiple joins. For partitioned tables, enable partition-wise joins so the engine can join partitions independently and avoid full-scan cross-partition work.
Measure changes with EXPLAIN ANALYZE and runtime metrics to confirm reduced logical reads and CPU. Only resort to hints or plan forcing after validating rewrites and index changes under both cold and warm cache to prevent regressions.
Optimize Aggregations and Windows
Aggressive row reduction is the fastest way to speed aggregates: apply WHERE filters and join reductions before grouping, and pre-aggregate large inputs in a derived table or materialized temp table so downstream work operates on much smaller sets. Replace costly DISTINCT or GROUP BY on wide rows by projecting only the grouping columns (and any INCLUDE columns via covering indexes) prior to aggregation. For high‑cardinality COUNT(DISTINCT) use approximate algorithms (e.g., HyperLogLog) when small error is acceptable, or implement a two‑phase aggregation (local partial aggregates, then global combine) for distributed or parallel engines.
Align physical structures with aggregation keys: clustered or partitioned data and B‑tree indexes on group/join keys let engines perform index‑only or ordered aggregations and avoid heavy sorts. Keep statistics fresh; skewed key distributions often cause excessive memory use or wrong parallel plans, so add histograms/multi‑column stats where supported.
When using window functions, minimize partition size and choose the tightest frame. Use PARTITION BY on selective keys to bound working sets and ORDER BY on an indexed column so the engine can stream rows. Prefer ROWS frames when you need deterministic row counts and RANGE only when you need value‑based bounds; avoid unbounded frames if you only need recent rows (use ROWS BETWEEN n PRECEDING AND CURRENT ROW). If the same windowed aggregates are used repeatedly, materialize them once and join rather than recomputing.
Watch runtime signals: sorts/spills and high memory grants indicate frame or partitioning problems—reduce frame width, increase work_mem/memory_grant cautiously, or switch to pre-aggregation. Validate changes with EXPLAIN ANALYZE and compare logical reads, memory usage, and tail latencies under both cold and warm cache.
Runtime Tuning and Maintenance
Continuously measure and guard the runtime environment rather than treating tuning as one-off surgery. Establish a performance baseline (median and p95/p99) and capture execution plans and runtime counters for every release so regressions are detected immediately. Automate telemetry collection (query runtime, logical/physical reads, CPU, waits) and wire alerts for increases in tail latency, plan changes, or growth in expensive operators.
Keep statistics and physical structures healthy: run ANALYZE/UPDATE STATISTICS after bulk loads, configure autovacuum/autoreorg thresholds to avoid bloat, and schedule targeted index rebuilds or use online reorg tools when fragmentation impacts read cost. Monitor index usage and write amplification; prefer targeted partial or composite indexes over broad ones that inflate maintenance. For partitioned data, maintain partition pruning health (fresh stats, consistent partition keys) and periodically drop/merge old partitions to reduce planner work.
Tune runtime memory and parallelism conservatively: adjust per‑query work memory (e.g., work_mem) to prevent excessive spills, set maintenance memory for faster reindex/vacuum, and cap parallel workers to avoid coordination overhead. Watch memory-grant and spill metrics; if queries spill or cause high memory grants, reduce frame sizes, add selective indexes, or increase server memory only after testing.
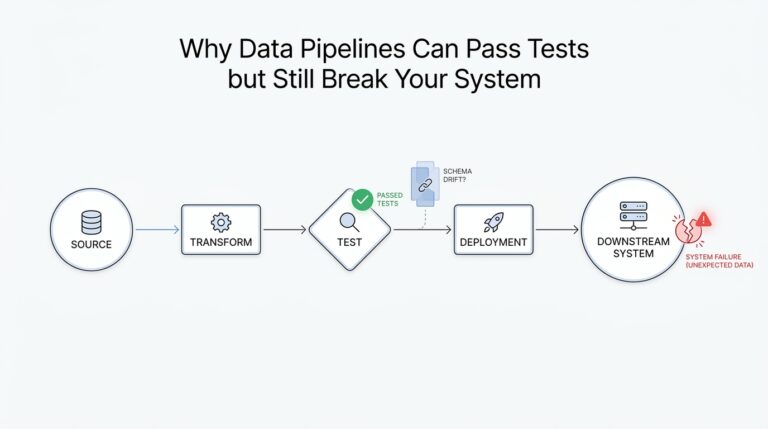
Manage plan stability and change control: refresh statistics before blaming plans, capture and compare plan artifacts, and use plan baselines/force plans sparingly and only after validating under both cold and warm cache. Test all tuning changes with representative concurrency and data distributions in staging, and provide an easy rollback path.
Operationalize maintenance: schedule regular health checks (bloat, long-running queries, autovacuum backlogs), automate performance regression tests in CI, and document tuning changes with dates and rationale. Combine proactive monitoring with disciplined maintenance windows to keep the optimizer working on accurate, compact data so queries stay predictable and fast.


