Why operational metadata matters
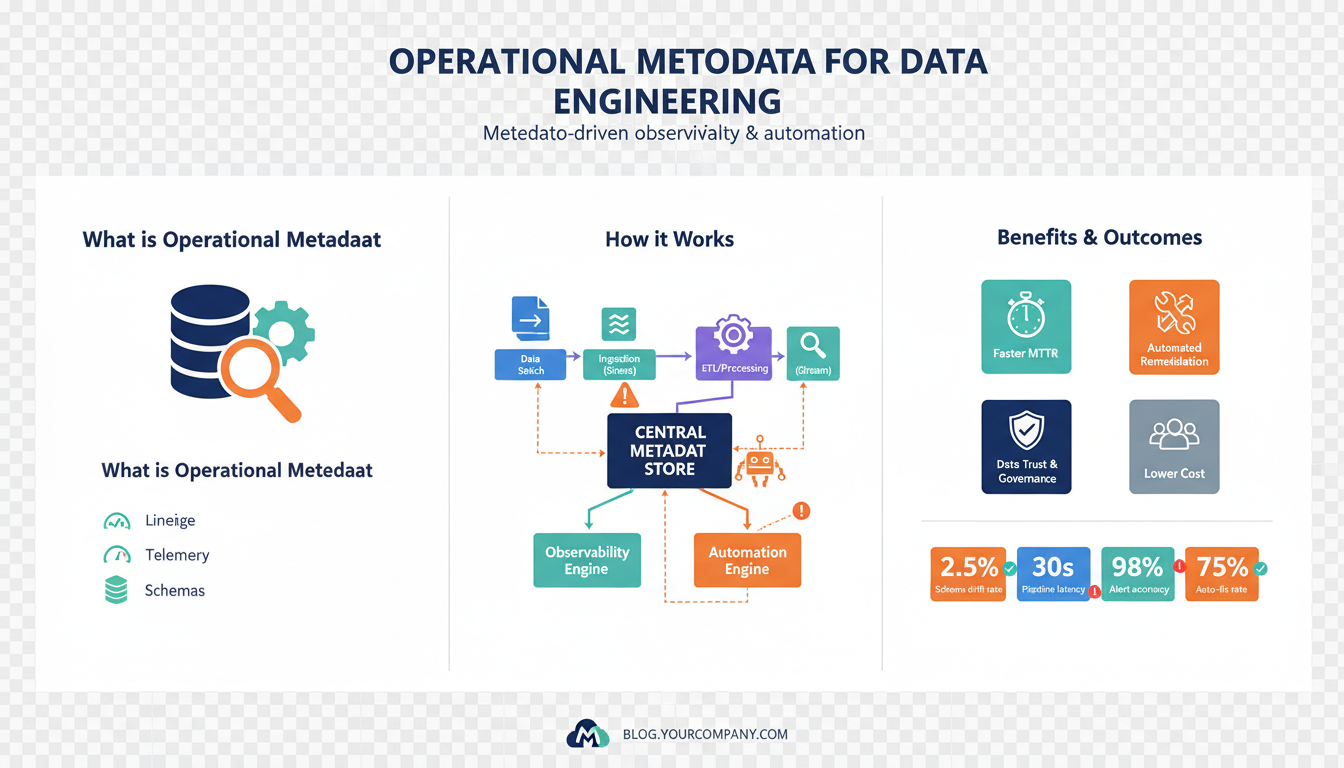
How do you detect a latent schema change, attribute a spike in downstream errors to a specific ETL job, and automate the safe backfill—all before a customer files a ticket? That problem is exactly why operational metadata belongs at the center of modern data engineering. By instrumenting and surfacing run-time information about jobs, schemas, SLAs, and lineage, we turn opaque data pipelines into observable, automatable systems. Early visibility into these signals is what makes metadata-driven observability actionable rather than theoretical.
Building on the architectural principles we covered earlier, operational metadata is the runtime record that answers “what happened, when, and why” for pipeline components. Operational metadata includes job execution logs, data quality checks, schema versions, partition manifests, and derived lineage; it differs from business metadata (like column descriptions) because it changes frequently and directly affects operations. For example, a schema_version field tied to every table write becomes invaluable when we need to roll back consumers or patch transformations. When you think in terms of events and state instead of static documentation, you can start designing systems that react rather than merely report.
One immediate payoff is faster, more accurate root-cause analysis through metadata-driven observability. Instead of hunting through logs across dozens of clusters, you can query a metadata index: SELECT job_id FROM runs WHERE status='failed' AND schema_version != consumer_schema_version LIMIT 1; and locate the offender in seconds. That single pattern—correlating job health, schema drift, and consumer errors via operational metadata—lets us escalate fewer incidents and resolve them faster. Observability built on metadata also reduces alert noise, because we can suppress downstream failures that are consequences of a single upstream change and instead notify the owning team with contextual evidence.
Metadata becomes the trigger for safe automated responses when we codify policies around it—this is metadata-driven automation. For routine failures you can implement automated retries, targeted backfills, or consumer-side adapters by querying the metadata store. For example, a lightweight orchestrator can run IF last_run_status='failed' AND retry_count<3 THEN enqueue(retry) or IF schema_change_detected AND consumers_stale>0 THEN create_advisory_ticket(owner); these are small, auditable actions that prevent manual firefighting. Automations driven by operational metadata also enable dynamic routing: we can progressively roll out schema changes and automatically throttle consumers that fall behind, preserving availability while we remediate.
Operational metadata also improves governance, collaboration, and auditability across teams responsible for data pipelines. When ownership, SLAs, and lineage live alongside run-time signals, handoffs become explicit and measurable: we can show exactly which downstream jobs were impacted by a failing upstream task and who owns the remediation. That traceability shortens mean time to recovery and makes postmortems constructive—rather than speculative—because the evidence is already structured. Reproducibility improves too: snapshots of metadata plus lineage let us recreate the exact conditions of a historic run for debugging or compliance purposes.
Taking this concept further, the practical next steps are clear: instrument everywhere, centralize metadata, and treat metadata as a first-class API. Instrumentation means emitting structured metadata (timestamps, versions, checksums, row counts) at each pipeline boundary; centralization means a consistent metadata schema and an index optimized for queries like the examples above; and APIs give teams the ability to build dashboards, automations, and governance tools without ad hoc scripts. When you adopt operational metadata as the control plane for your data platform, you transform pipelines from passive ETL jobs into resilient, observable services—ready for the automation and scale that modern analytical workloads demand.
Core operational metadata types
Building on this foundation, operational metadata is the live telemetry that lets you observe and act on pipelines instead of reacting after the fact. In the first 100–150 words we front-load the key concepts because searchers and practitioners look for concrete types: job runs, schema versions, data-quality results, lineage, partition manifests, SLAs, and owner annotations. These core operational metadata types feed metadata-driven observability and metadata-driven automation; when you capture them consistently you can query, correlate, and trigger deterministic responses across environments. Treat these types as the ingredients of a control plane that coordinates detection, diagnosis, and remediation.
Runtime and execution metadata record what actually happened during a job run. Capture fields like run_id, job_name, start_ts, end_ts, status, exit_code, host, and retry_count for every execution. This information answers operational questions—when did the failure begin, where did it run, and how often has it retried—and supports fast root-cause queries across clusters. In practice, we index run metadata in a small, fast store and add tags (e.g., deployment, git_sha) so you can pivot from a failed run to the exact code version that produced it.
Schema and structural metadata track how data shapes change over time and who introduced those changes. Record schema_version, column-level hashes, nullable/type changes, and evolution events with timestamps and author identity. These signals let you correlate consumer failures with an upstream schema change, perform targeted consumer rollbacks, or generate adapter transformations automatically. For example, when schema_version != consumer_expected_version, you can surface an advisory to the consuming team rather than letting errors cascade into production.
Data-quality metadata contains the checks and their outcomes that validate the payload at boundaries. Store check_id, rule_expression, result (pass/fail/warn), failure_count, and sampled failure rows or fingerprints for each run. Row counts, null rates, distribution summaries, and checksums are indispensable when deciding whether to backfill or quarantine data. Because quality verdicts change frequently, index them for fast queries (e.g., “find failing checks for table X in the last 24 hours”) and attach links to sample records or digests to accelerate debugging.
Lineage, partition manifests, and provenance metadata explain where a datum came from and how it was transformed. Persist directed lineage edges (producer_job, consumer_job, transformation_id), partition manifests with partition_key, min_ts, max_ts, and checksums, and snapshots that capture a table’s exact state for reproducibility. That provenance enables surgical interventions: you can backfill only affected partitions, build differential replays, or mute downstream alerts when upstream retries are in progress. Lineage also powers impact analysis queries like “which downstream dashboards read this partition?”.
Operational governance metadata—SLAs, ownership, annotations, and audit trails—makes responsibilities explicit and actionable. Assign owner_id, escalation_policy, SLA_window, and last_acknowledged timestamps to datasets and jobs so automation rules can notify the right team rather than broadcasting noisy alerts. Audit logs that record policy changes, manual overrides, and automated actions ensure postmortems are evidence-driven and that compliant runs are reproducible for regulatory needs.
How do you turn these types into automation? Combine targeted queries against the metadata index with compact policy rules that act as the orchestration layer. For example, a rule might read: IF last_run.status=’failed’ AND failing_check_count>0 AND owner_responded=false THEN create_ticket(owner_id) AND enqueue(retry, partition=manifest.partition_key). A practical SQL-ish example looks like: SELECT run_id FROM runs WHERE status='failed' AND schema_version<>consumer_expected_version LIMIT 1;—use that result to trigger an advisory to owners and a conditional backfill. Instrumentation, consistent schemas, and a single queryable metadata store let us convert detection into safe, auditable actions; next, we’ll look at how to model metadata schemas and storage for scale.
Instrumenting pipelines for metadata
Building on this foundation, the first practical step is to treat operational metadata as a telemetry layer you design deliberately rather than an afterthought. Start by deciding which signals you must capture at every pipeline boundary: run identifiers, start/end timestamps, status, exit_code, git_sha, schema_version, partition_key, row_counts, checksums, and sampled failure rows. How do you ensure instrumentation is both comprehensive and performant? Define a minimal, structured event for high-frequency paths and an enriched event for critical boundaries so you capture actionable detail without overwhelming your stores or networks. This approach makes metadata-driven observability tangible from day one.
Decide where to emit metadata and standardize the shape of events across components. Emit lightweight run metadata from your orchestrator at job start/stop and have transformation tasks augment that event with structural and quality signals at checkpoints (for example, {"run_id":"r123","start_ts":...,"schema_version":"v2","row_count":10000}). Ingest these events through the same channel—an event bus or a metadata API—so you can index and correlate them reliably. Consistent field names and tags (environment, team, dataset) let you pivot quickly during incident response and reduce cognitive load when writing queries or policies.
Instrument at the right places in code and infrastructure to make these signals useful. Add metadata emits at the ingestion handshake (when a file or stream partition is accepted), after every major transformation, and at sink writes where you can capture final row_counts and checksums. In practice, attach a small helper in your job templates or SDK—emit_metadata(run_id, status, metrics)—and call it from retry handlers, error catch blocks, and success paths so every outcome is observable. For high-throughput paths, sample full failure payloads and store fingerprints or fingerprints+links instead of raw rows to balance debuggability and cost.
Choose storage and indexing strategies that support fast, ad-hoc queries and deterministic automation. Store run metadata in a fast key-value/indexed store for lookups by run_id or dataset, and persist richer quality and lineage artifacts in a document or columnar store optimized for analytics. Index fields you’ll query frequently—dataset, schema_version, status, partition_key, and 95th percentile duration—to enable queries like SELECT dataset, percentile(duration,95) FROM runs WHERE date=... GROUP BY dataset. Retention policies should be explicit: keep summary metrics long-term but externalize large samples to an archival blob store with pointers in the metadata record.
Instrumented metadata becomes the trigger surface for metadata-driven automation when you codify rules and safety guards. Define compact, auditable policies such as: IF latest_run.status=’failed’ AND failing_check_count>0 AND owner_ack=false THEN create_advisory(owner_id) ELSE enqueue(retry, partition=affected). Implement idempotent actions and record every automatic decision as a metadata event (who/what triggered it, timestamp, outcome) so postmortems and audits reconstruct exact sequences. Integrating owner annotations and SLA windows into the same index reduces false positives and lets automation escalate to the right team instead of generating noisy alerts.
Operationalizing instrumentation requires developer ergonomics and governance to scale. Provide an SDK and job template so teams emit consistent metadata without bespoke scripts, enforce schema evolution with versioned contracts, and add CI tests that validate metadata shape and example queries. Build dashboards that surface heatmaps (slow jobs, failing checks, schema drift) and expose the metadata API as a first-class tool for both humans and automation. Taking these steps turns ad-hoc logs into a control plane: you get faster diagnosis, safer automated responses, and the substrate for the modeling and storage strategies we’ll discuss next.
Monitoring metrics and alerts
Building on this foundation, operational metadata must feed a deliberate monitoring and alerting strategy if you want pipelines that detect trouble before customers notice. Start by treating operational metadata as your primary telemetry source: instrumented run records, schema versions, data-quality verdicts, and partition manifests become the concrete metrics you monitor. Front-load key signals—run latency percentiles, failing_check_count, consumer_lag, and schema_drift_count—so your dashboards and alerts reflect the same control plane that powers automation. When you align monitoring metrics with metadata-driven observability, you gain the ability to ask targeted operational questions and act on them quickly.
Design metrics with intent: measure business-impacting symptoms and root causes separately so you can both detect incidents and diagnose them. Capture high-level health metrics like dataset_availability (boolean), job_success_rate (percentage), and downstream_error_rate, and pair them with forensic metrics such as run_duration_ms, rows_processed, and schema_version_mismatch_count. Use labels that map back to ownership and environment (team, dataset, env) so you can pivot from an alarm to the responsible owner immediately. Concrete naming and consistent label conventions make ad-hoc queries and automation rules reliable across teams.
Alerting should prioritize signal over noise by preferring correlated, contextual alerts to raw symptom pages. Instead of paging on every failing consumer, alert on correlated conditions: for example, page only when downstream_error_rate > threshold AND upstream_schema_drift_count=0, but create a ticket when downstream_error_rate spikes and an upstream schema change is detected. How do you choose thresholds and escalation levels? Use historical operational metadata to derive baselines and alerting windows—calculate the 95th percentile of run_duration by job and set SLA breach alerts relative to that distribution rather than a fixed timeout. This reduces false positives and focuses human attention where it matters.
Implement an observability pipeline that separates high-cardinality event storage from time-series metrics to keep queries fast and alerts actionable. Push aggregated metrics (percentiles, counts, gauges) to a time-series system for real-time alerting, while sending enriched events (sampled failure rows, lineage, git_sha) to a document store or metadata index for on-demand diagnosis. Link the two systems with a stable correlation key such as run_id so an alert can surface the exact metadata record and the minimal sample needed for debugging. Be mindful of cardinality: avoid tagging metrics with partition_id or raw user_id at full fidelity; instead emit partition-level summaries and use hashed pointers to samples stored in blob storage.
Automated responses and alert actions must be auditable and safe because alerts will increasingly trigger remediation. Prefer idempotent actions such as enqueuing a retry for a specific partition, creating an advisory ticket with links to failure samples, or muting downstream alerts for a bounded window while a backfill runs. Gate automated escalations with rate limits, owner acknowledgements, and manual approval for destructive operations like schema rollbacks. Record every automated decision as operational metadata (actor, rule_id, timestamp, outcome) so postmortems reconstruct exactly what happened and your automation rules evolve safely.
Finally, instrument your monitoring practice with continuous validation: run chaos drills that inject schema changes or delay upstream runs and verify that alerts route to the right teams and automation behaves as intended. As we discussed earlier, when you centralize metadata and standardize event shapes, you can write compact, auditable policies that convert detection into deterministic actions; monitoring metrics and alerts become the live feedback loop that closes the observability->automation cycle and prepares us to scale the metadata schema and storage design that follows.
Metadata-driven automation workflows
Building on this foundation, the practical value of metadata-driven automation is that it converts detection into safe, repeatable action instead of a long ticket-and-escalation dance. You already capture run metadata, schema versions, quality checks, and lineage; the missing piece is a small, auditable policy layer that continuously queries that index and executes bounded remediations. When you front-load automation with operational metadata and observability signals, you shorten mean time to recovery and keep humans in the loop for decisions that require judgment rather than repetitive toil.
Start by modeling automation rules as compact, declarative policies that operate against the metadata API and produce idempotent commands. A policy should read like an invariant: it evaluates deterministic signals (last_run.status, failing_check_count, consumer_lag, schema_version) and emits a single action or a small set of guarded actions. For example, a safe rule might be expressed as IF schema_version != consumer_expected_version AND consumer_lag>threshold THEN create_advisory(owner_id) AND mute_downstream_alerts(window=30m) which documents intent, scope, and the safety window in a single place. Keep rules small, make them reversible, and require explicit owner acknowledgement before any destructive action like rollbacks or schema rewrites.
Choose an orchestration pattern that fits operational scale: event-driven actuators for low-latency remediation, a centralized policy engine for cross-dataset consistency, or a hybrid where teams own domain-specific rules surfaced through a shared policy registry. In an event-driven approach, metadata events (run_end, check_fail, schema_evolution) flow through the same bus you use for telemetry; small worker processes subscribe, evaluate policies, and write action-events back to the metadata store. In a centralized engine, policies run in a scheduled or on-change loop and emit commands to domain-runbooks—this reduces duplication but requires strong governance and role-based access controls. Use correlation keys like run_id and dataset_id so every automated action links back to the original evidence.
Safety and auditability must be non-negotiable design constraints for automation. Gate automated escalations with rate limits, owner acknowledgement flags, and approval tiers for operations that can affect data availability or compliance. Record every automated decision as an auditable metadata event containing actor (rule_id or service), inputs (query results, sample fingerprints), action, and outcome; store these alongside your run, lineage, and quality records so postmortems reconstruct the exact sequence. Instrument the automation layer with the same observability patterns you apply to jobs—latency percentiles, error rates, and success ratios—so you can tune policies using historical operational metadata rather than anecdote.
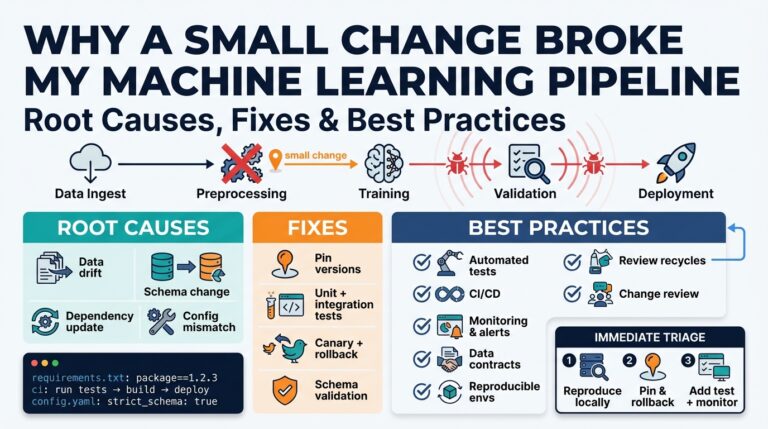
To make this concrete, imagine a common production incident: an upstream schema change introduces a new non-nullable field that breaks several dashboards. Your automation pipeline detects a spike in schema_version_mismatch_count and failing data-quality checks for table X, then enqueues a targeted backfill for partitions whose max_ts overlaps the change window, creates an advisory ticket addressed to the owning team with links to sampled failure rows, and mutes downstream dashboard alerts for 15 minutes while the backfill runs. The backfill action is idempotent and scoped by partition manifest: enqueue(backfill, dataset=table_x, partitions=[p20251201,p20251202], reason=auto_schema_quarantine) so retries and audits remain deterministic. That flow preserves availability, provides context to owners, and prevents noisy escalation.
Operationalizing these workflows requires continuous validation and a policy lifecycle: test policies in staging with simulated metadata events, run chaos drills that inject schema drift and verify remediation behavior, and maintain a versioned policy registry with CI checks that assert non-conflicting rules. As we discussed in the instrumentation section, treat metadata as a first-class API—instrument operators to emit actionable fields, centralize indexes for fast queries, and expose the automation audit trail for both humans and machines. This approach prepares you to model metadata schemas and storage for scale and to iterate on policies with confidence.
Implementation patterns and tools
Building on this foundation, operational metadata should be treated as a programmable substrate rather than passive logs—this idea underpins metadata-driven observability and metadata-driven automation from day one. We start with a clear pattern: emit structured events with a minimal, consistent envelope for high-frequency paths and enriched artifacts for checkpoints that require deep inspection. By front-loading schema_version, run_id, dataset, and partition_key in the first 100–150 bytes of each event, you make most queries and policy evaluations trivial and fast. Why does this matter? Because when you can query the metadata index in seconds, you convert investigation and remediation from guesswork into deterministic workflows.
A practical architectural pattern separates three concerns: telemetry ingestion, a queryable metadata index, and a policy/action layer. In one implementation you stream metadata events to a durable event bus, index lightweight run and status fields in a fast key-value store for low-latency lookups, and persist richer quality and lineage artifacts to a document or analytics store for ad-hoc forensics. Another pattern centralizes policy evaluation in a single engine that polls the metadata API and emits idempotent commands, which simplifies cross-dataset consistency at the cost of a governance surface. We frequently recommend a hybrid model where domain teams own small, domain-bound rules surfaced through a shared registry so you get both agility and centralized auditability.
Standardize the event shape and provide an SDK so teams emit metadata without bespoke code. Define a minimal event contract and a versioning strategy—v1, v2 fields—so you can evolve without breaking consumers. Implement helper functions like emit_run_start, emit_run_end, and emit_quality_check that attach git_sha, environment, and owner_id automatically; these helpers keep instrumentation consistent across orchestrators and execution environments. When you enforce these contracts in CI (schema validation tests and integration smoke tests), teams rarely wonder which fields to include during incident response.
Choose storage and indexing with query patterns in mind. Store run-level records in a low-latency index keyed by run_id and dataset for fast pivots during incident response. Persist data-quality verdicts, sampled failure fingerprints, and lineage graphs in a document store or columnar table where you can run analytical joins and impact analysis; keep large samples and payloads in blob storage and store only pointers in the metadata record. Explicit retention policies—summaries long-term, raw samples short-term—control cost and preserve the signal you need for automation.
For orchestration and tooling, integrate metadata with both batch and streaming systems. Let your orchestrator emit run metadata at start/stop, and let stream processors emit partition manifests and offsets as they progress. Implement small event-driven actuators that subscribe to specific metadata topics and evaluate short, declarative rules close to the data; reserve a centralized policy engine for rules that span many datasets or require stronger governance. Correlation keys like run_id and dataset_id are essential so every alert, ticket, or automated action links back to the original evidence.
Observability is the visible surface of your metadata control plane—push aggregated metrics to a time-series system for real-time alerts and keep enriched events available for diagnostics. Separate metrics from high-cardinality events to avoid alert noise and ensure fast queries. Use historical operational metadata to compute baselines for thresholds and to tune alert windows; perform chaos drills that inject delayed runs or schema changes to validate routing and automation paths. This approach reduces false positives and focuses human effort where it changes outcomes.
Security, governance, and auditability must be baked into tooling rather than added later. Enforce role-based access control on the metadata API, require rule approvals through a versioned policy registry, and record every automated decision as an auditable event containing the rule_id, inputs, actor, and outcome. These audit trails let you reconstruct remediation paths precisely and support compliance requirements without slowing down everyday operations.
A concrete example brings these patterns together: an upstream schema change emits a schema_evolution event, the metadata index flags schema_version_mismatch_count > 0, and an event-driven actuator evaluates a rule that creates an advisory ticket, enqueues a targeted backfill for affected partitions, and mutes downstream dashboard alerts for a bounded window. The backfill command is idempotent and scoped by partition manifest: enqueue(backfill, dataset=table_x, partitions=[p20251201,p20251202], reason=auto_quarantine). That flow preserves availability, gives owners context, and provides an auditable trail for postmortems.
While we covered instrumentation and policy patterns earlier, the next practical step is modeling metadata schemas and storage for scale so your automation rules remain performant and safe as your platform grows. How do you ensure rules remain safe as you scale? We’ll examine schema design, indexing strategies, and governance practices next to make that question operationally solvable.
