Define goals and KPIs
Start by tying analytic work to a measurable business outcome: what specific behavior in category pages will move revenue—more product clicks, higher add-to-cart rate, reduced exits, or larger average order value. Quantify each objective with a timebound target and a baseline (for example: increase category→PDP click-through rate by 15% within 60 days from a 6% baseline). Choose a small set of primary KPIs and one secondary indicator per objective to avoid signal noise: conversion rate per category, category-to-PDP CTR, add-to-cart rate, bounce/exit rate, scroll depth (to identify content reach), and average order value for users originating in the category. Complement these with heatmap-specific metrics: interaction density (percentage of page area receiving clicks/taps), hotspot concentration (top X% of interactions), and dead-zone proportion (areas with zero engagement). Define segmentation and instrumentation up front—desktop vs. mobile, new vs. returning users, traffic source—and record sample sizes and measurement windows needed for statistical confidence. Assign ownership, reporting cadence, and success criteria (what triggers a design change or A/B test). Capture baseline heatmaps before interventions so KPI changes can be confidently attributed to layout or content changes.
Install tracking and tools
Choose a tag manager plus an analytics and heatmap stack that fit your scale (e.g., GTM or an equivalent TMS, a primary analytics platform, and a dedicated heatmap/recorder). Deploy a single, lightweight base snippet through the tag manager to fire pageview events and load the recorder; avoid multiple analytics/recorder instances to prevent duplicated signals and performance hits. Define a strict dataLayer schema for category pages capturing category_id, category_name, product_count, sort/filter state, and user segment flags; use those keys consistently across page loads and virtual pageviews so heatmap and analytics events can be joined to business KPIs. Instrument event tags for category→PDP clicks, add-to-cart, filter usage, and CTA taps; include scroll-depth triggers (25/50/75/90) and form-submit events. For single-page apps, fire virtual pageviews on route change and push context into the dataLayer so heatmaps record meaningful session context. Configure recording/sample rates to balance data volume and privacy—capture enough sessions per segment for statistical confidence but stop full-session recording for all users if unnecessary. Respect consent: load trackers only after user consent or use consent-aware tag firing. Validate in a staging environment using tag manager preview and network inspection—check that events contain the expected category payload, timestamps, device type, and session IDs. Maintain a tagging inventory with clear naming conventions and ownership, snapshot baseline heatmaps before any redesign, and consider adding server-side event collection for critical conversion events to improve reliability and data completeness.
Choose heatmap types
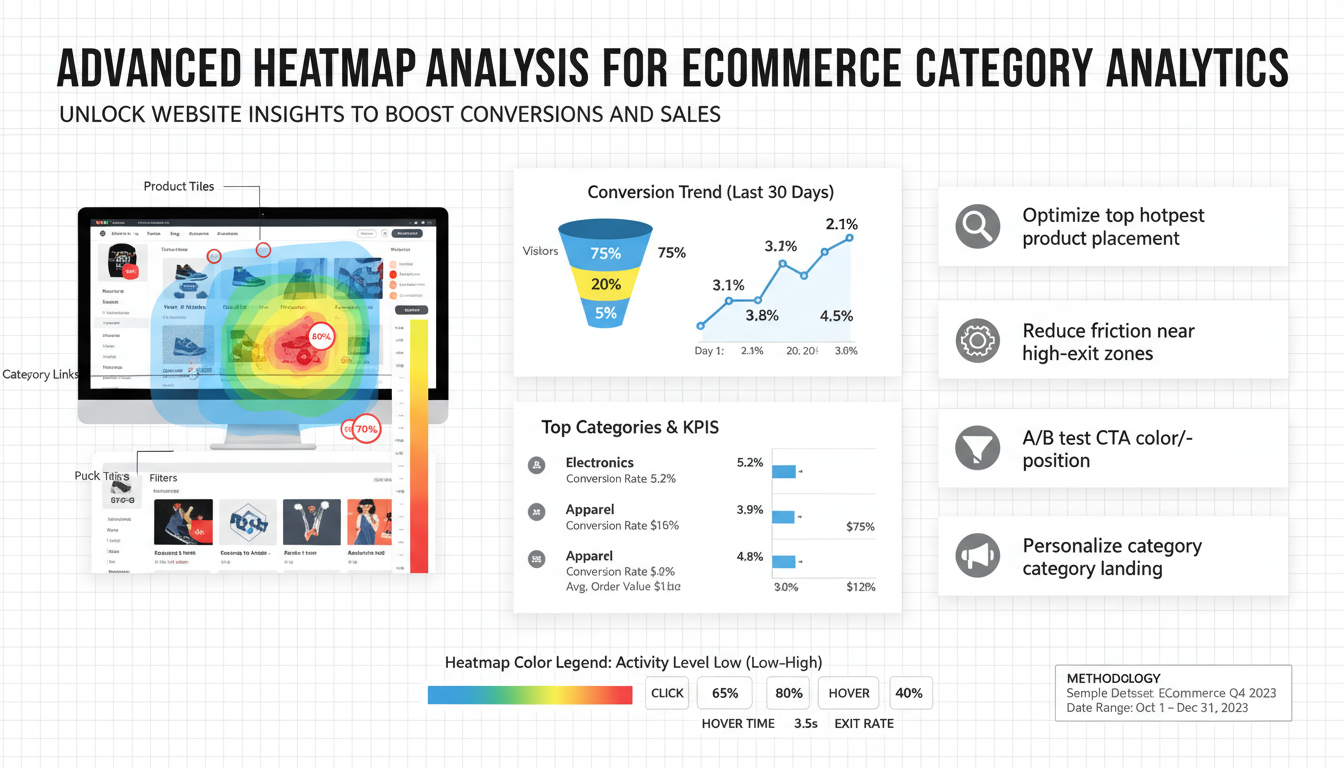
Match the heatmap type to the KPI and user context before collecting data. For diagnosing product discovery on category pages, use aggregated click/tap maps to see where users actually land their interactions and compare desktop vs. mobile; pair these with a revenue-weighted zone overlay to highlight clicks that produce PDP visits or conversions. Use scroll maps to reveal how far users traverse long lists or promotional hero content—if a meaningful share never reaches mid-list products, prioritize above-the-fold rearrangements and lazy-load strategies. Hover/mouse-move maps help surface attention patterns on desktop (use cautiously on touch devices), and can indicate where users expect interactive affordances or more information. Implement rage-click and error heatmaps to detect broken links, non-responsive filters, or confusing controls that drive exits. For funnel-oriented questions—category→PDP→add-to-cart—apply step-overlay heatmaps that compare interaction density across those steps and surface drop-off micro‑moments. Complement aggregate views with targeted session replays for representative users in each segment to uncover intent and context behind hotspots. Sample intentionally: collect enough sessions per device and traffic source to trust differences, but avoid over-sampling rare segments. Finally, prioritize privacy and consent when recording; opt for anonymized, aggregated visualizations for reporting and reserve replay access for authenticated analysts only. Practical rule: use aggregated heatmaps to spot patterns, overlays to measure business impact, and session replays to validate and iterate on fixes.
Segment by device and traffic
Aggregating heatmaps across all visitors hides critical differences: desktop users hover, scan wide grids, and often use filters, while mobile users rely on thumb reach, tap targets, and may never see mid-list items. Segment visualizations by device (desktop, tablet, mobile) and by traffic source (organic search, paid, email, social, direct) plus new vs returning so you can surface behavior that maps directly to business levers—e.g., paid traffic that bounces before the hero or organic users who scroll deeper but don’t click.
When comparing segments, measure the same KPIs across slices: interaction density, hotspot concentration, dead‑zone proportion, scroll depth, category→PDP CTR, and add‑to‑cart rate. Use revenue‑weighted overlays and step‑overlay heatmaps to link hotspots to downstream value. Treat hover/mouse‑move maps as desktop‑only; prioritize tap/click and scroll maps for touch. Inspect session replays from representative users in each segment to validate intent behind top and missing hotspots.
Sampling and instrumentation should be segment‑aware: capture a reliable sample per segment (aim for roughly 500–1,000 sessions for aggregate heatmaps where feasible), increase recording rates for high‑value traffic (email, paid campaigns) and decrease for low‑value noise. Configure consent‑aware, device‑specific tag firing and store segment flags in the dataLayer so heatmap data joins to analytics. Finally, run device‑ and traffic‑specific A/B tests for layout changes—don’t assume a desktop win will translate to mobile without segment-level validation.
Identify friction and hotspots
Combine visual signals with quantifiable KPIs to quickly locate where users stall and where value concentrates. Start by comparing click/tap maps, scroll maps, and rage‑click/error overlays across device and traffic segments; hotspots that drive PDP visits or add‑to‑cart should be revenue‑weighted so fixes target high‑value areas. Treat dead zones (large areas with zero engagement) and hotspot misalignment (frequent clicks on non‑interactive elements) as friction symptoms rather than finished diagnoses.
Look for these diagnostic patterns: deep scroll but low click density suggests weak product affordances or poor merchandising; concentrated clicks on images or labels without corresponding PDP CTR implies broken links or misleading affordances; clustered rage clicks around filters or sort controls point to UI bugs or unresponsive elements; sudden hover/mouse‑move dwell on non‑interactive text can indicate missing microcopy or CTAs. Quantify each finding with interaction density, hotspot concentration, dead‑zone proportion, category→PDP CTR, and add‑to‑cart rate so prioritization is data‑driven.
Validate visual signals with targeted session replays from representative users (aim for reliable samples per segment), tag suspicious sessions with hypothesis labels, and estimate potential impact using revenue overlays. Prioritize fixes by downstream value and ease of execution, then measure change with before/after heatmaps and KPI deltas rather than intuition alone.
Convert insights into tests
Start by turning visual signals into a single, measurable hypothesis: identify the observed pattern (dead zone, misplaced hotspot, rage‑click cluster), name the affected segment and KPI, and state the expected delta. Example: “For mobile users from paid search, moving the primary CTA into thumb-reach will increase category→PDP CTR by 12% over 30 days.” Keep hypotheses precise, timebound, and tied to revenue or downstream conversion metrics.
Prioritize tests by expected impact, effort, and confidence. Use a simple scorecard (impact × confidence ÷ effort) to rank ideas so fixes that unblock high‑value hotspots rise to the top. Favor small, incremental changes that isolate variables—reordering tiles, adjusting CTA size/placement, fixing a mislinked element—over broad redesigns that muddy attribution.
Choose the right experiment type and guardrails: run A/B or split URL tests for layout and CTA changes, use feature flags for staged rollouts, and reserve multivariate tests for mature pages with very high traffic. Always run a power calculation before starting and define a minimum detectable effect, primary and one secondary metric, segment-level criteria, and a pre‑registered analysis window to avoid peeking bias.
Instrument and validate: bind tests to the same dataLayer schema used for heatmaps so category_id, device, and traffic source follow through. Track both interaction maps (clicks/taps, scroll depth) and business events (PDP views, add‑to‑cart, revenue). QA in staging with tag manager preview and session replays to confirm test variants render and fire expected events.
After the test, complement statistical results with post‑test heatmaps and representative session replays to verify that hotspots shifted as intended and no new friction appeared. If results are positive, roll out gradually and monitor segments; if negative, use the heatmap evidence to form the next focused hypothesis.