Limits of Dashboards for Modern Analytics
Building on this foundation, we need to confront a practical reality: dashboards were designed for summary, not for the demands of real-time analytics, AI-driven analytics, or operational control. Dashboards excel at historical snapshots and KPI monitoring, but their polling-refresh model, fixed schemas, and pre-aggregated queries introduce latency, reduce fidelity, and limit exploratory analysis. In the first 100 words we’ve already hit the core tension: dashboards are readable and useful, yet they struggle when you require sub-second insight, high-cardinality joins, or automated decision loops. Recognizing those boundaries lets us choose the right components for a modern, scalable data platform instead of overloading visualization tools.
One major limitation is the implicit trade-off between latency and query complexity. Dashboards commonly rely on scheduled ETL jobs or materialized views that precompute aggregates; that approach reduces query cost but creates staleness and hides fine-grained signal. For example, if you’re troubleshooting a sudden drop in conversion rate you’ll want row-level event context and the ability to run ad-hoc joins across user traits, session signals, and experiment flags—operations that many dashboard backends either throttle or simplify through sampling. When you depend on those simplified views, you can miss error patterns, causal drivers, or early signs of model drift.
Scalability and high-cardinality data multiply these problems. As your telemetry grows—think per-user, per-device, per-feature dimensions—the number of distinct keys explodes and pre-aggregations become impractical or prohibitively costly. Dashboards either restrict dimensions, roll up data aggressively, or push heavy queries against your warehouse during business hours, degrading performance for analysts and applications alike. In practice we see teams hit a ceiling where adding new metrics or segmentation multiplies query times and infrastructure bills, forcing engineering workarounds that reduce analytical expressiveness.
Dashboards also struggle with operational and event-driven use cases because of their pull-based, human-centric workflows. Real-time analytics use cases—fraud detection, personalization, autoscaling based on live signals—require streaming ingestion, continuous feature computation, and sub-second inference. How do you make an action that must occur within a few hundred milliseconds when your visualization platform refreshes every minute? If your operational decisions rely on dashboards rather than on a streaming pipeline and low-latency APIs, you’ll either act too slowly or build brittle synchronous dependencies on manual inspection.
When we add machine learning into the loop the gap widens: dashboards are poor primitives for model governance, feature stores, and drift detection. Visualizing model outputs in a dashboard gives you visibility after the fact, but it doesn’t automate retraining triggers, compare production distributions to training distributions, or feed corrected labels back into a pipeline. Instead, production-grade ML workflows need programmes that push predictions and features to a feature store, record inference metadata, and surface automated alerts via observability tooling. For instance, a better pattern is to stream features to a model-serving tier and emit metrics and traces that an observability system ingests—then surface summaries to dashboards as one of many outputs rather than the control plane.
Taken together, these limits imply a clear shift: dashboards should be part of your monitoring and storytelling layer, not the core real-time decision engine. For teams moving from point-in-time reporting to real-time, scalable data platforms, the next steps are architectural: introduce event-driven ingestion, stream processing for continuous feature computation, feature stores and low-latency model serving, plus model and data observability. Taking this concept further, we’ll examine concrete patterns and implementation choices that let dashboards complement—rather than constrain—real-time analytics and AI-driven workflows.
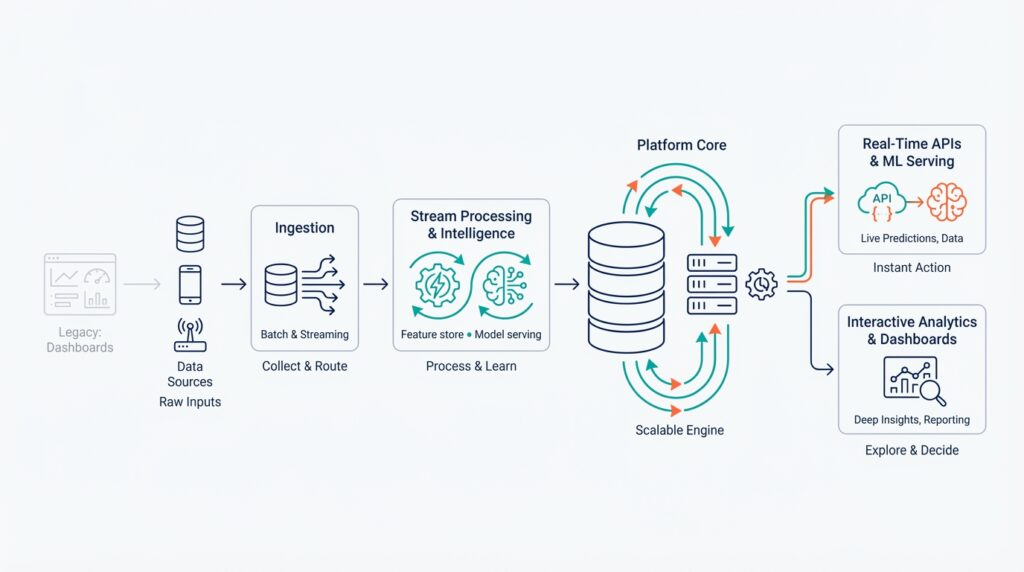
Core Components of AI Driven Analytics Architecture
Building on this foundation, the architecture we design must center around AI-driven analytics and real-time analytics as first-class concerns, not afterthoughts. The first thing to decide is how data enters the system: high-throughput, low-latency ingestion and stream processing are non-negotiable when you want sub-second decisioning. In practice that means an event bus or change-data-capture (CDC) pipeline that preserves granular events and schema evolution so you can compute features and metrics continuously rather than on schedule.
Ingestion and the event layer serve as the system’s nervous system. You should instrument producers to emit canonical event schemas and use partitioning strategies that align with your query patterns — for example, user-id partitioning for personalization versus session-id for realtime observability. This approach reduces hotspots and makes downstream stream processing deterministic; when a fraud signal spikes, you want the exact row-level context available immediately. These choices also shape cost and scalability for the rest of the data pipeline.
Stream processing is where raw events become actionable signals. Use stream processing frameworks that support stateful computations and exactly-once semantics so you can compute rolling windows, joins, and enrichments continuously without manual reconciliation. For instance, computing per-user rolling CTR (click-through rate) requires stateful aggregation with late-arrival handling; a windowed join enriches events with membership in current experiments. Continuous feature computation eliminates ETL lag and keeps your feature store populated with operational features for model serving.
Storage needs to be tiered: hot stores for low-latency lookup, warm stores for nearline aggregation, and a durable lakehouse for raw material and historical training data. Choose a fast key-value or in-memory layer for online lookups and a columnar OLAP store for analytical workloads; this dual path preserves both the fidelity required for model governance and the throughput needed for dashboard queries. Combining a cheap object store with a performant query engine keeps costs predictable while allowing you to rehydrate features for retraining or forensics.
A feature store (a centralized system for storing and serving ML features) and model serving layer are the operational glue. Separate offline feature computation (for training) from online feature serving (for inference) and ensure the feature store provides consistent serialization, TTLs, and lineage metadata. For model serving, prefer asynchronous inference APIs for heavy models and low-latency RPC or edge-embedded runtimes for tight SLAs; caching recent predictions and feature vectors reduces tail latency for high-throughput endpoints.
Orchestration, observability, and governance complete the control plane. Orchestration pipelines should be declarative and idempotent so we can replay or backfill data when models change, and observability must cover both data (schema drift, missing partitions) and model behavior (prediction distributions, latency percentiles). How do you detect model drift before it affects customers? Instrument production inputs and outputs, compute divergence metrics against training distributions, and wire automated retrain triggers into your pipeline so corrective actions are reproducible and auditable.
Finally, expose a decisioning plane—APIs and event sinks that let downstream services act on predictions—rather than routing decisions through dashboards. As we discussed earlier, dashboards remain essential for monitoring and storytelling, but the runtime decision loop should be served by low-latency APIs, streaming triggers, or message queues that connect model serving to actuators. When these core components — event ingestion, stream processing, tiered storage, feature store, model serving, orchestration, and observability — are designed to work together, you get an AI-driven analytics platform that scales, adapts, and supports both exploratory analysis and real-time automation.
Designing Real-Time Streaming Ingestion Pipelines
When you need sub-second decisions, the ingestion layer becomes the most important part of the platform: it must preserve fidelity, order, and schema while scaling to millions of producers. Real-time streaming ingestion pipelines are not an afterthought; they are the contract between producers and every downstream consumer—analytics, feature stores, and model-serving systems. Design choices made here (partition keys, schema evolution rules, retention policies) determine whether you can compute features continuously or whether you’ll spend engineering cycles on brittle backfills. Treat ingestion as a first-class product with SLAs, observability, and test harnesses so producers and consumers can evolve independently.
Building on this foundation, start by standardizing producer-side contracts and schema governance so events remain reliable as they flow through the system. Define canonical event types and register them in a schema registry (Avro/Protobuf/JSON Schema) with clear compatibility rules and migration paths; require producers to validate locally before emitting. Instrument producers to include metadata—producer id, client version, event timestamp, and causal trace id—so replay, lineage, and troubleshooting are straightforward. Enforcing these contracts reduces downstream logic for enrichment and deduplication and makes schema evolution a predictable operation rather than a firefight.
Partitioning and routing strategy comes next because it controls parallelism, state-locality, and join semantics. Choose partition keys that align with your most common stateful operations: use user-id or account-id when you need per-entity aggregation and session-id or region when temporal locality matters; avoid high-cardinality keys for global aggregations. Design partitions to limit hotspots (introduce sharding or hash prefixes when a single customer or device dominates traffic). Also decide retention and compacting policies at ingest: compacted topics for latest-key lookup and append-only topics for audit and model training give you both fast online lookups and durable historical material.
Delivery semantics determine operational complexity, so decide early whether the broker+processor stack will provide at-least-once or exactly-once semantics and design idempotency accordingly. Where exactly-once is required, use transactional writes or atomic sinks and keep your state checkpointed; when you can tolerate at-least-once, implement idempotent consumers or use deduplication windows keyed by a stable event id. A common producer pattern is producer.send(batch, acks='all') with monotonic offsets and server-side dedupe; on the consumer side, persist last-processed offset after checkpointing state. These patterns reduce silent correctness errors that otherwise surface as model drift or inconsistent analytics.
Plan for disorder and lateness explicitly with watermarking, allowed lateness, and side outputs for late arrivals so your streaming aggregations remain accurate rather than brittle. Use event-time windowing when event timestamps reflect causal order, and set reasonable allowed-lateness to balance completeness versus latency; route very-late events to a replay/backfill pipeline that updates the lakehouse and triggers incremental retraining. Make state management explicit: set TTLs for ephemeral state used in rolling metrics, snapshot state frequently for fast recovery, and provide tooling to replay segments for forensic recomputation when models or enrichment logic change.
Operational design rounds out correctness and cost control: handle backpressure with client-side batching and graceful throttling, autoscale ingestion brokers and consumers based on partition lag, and expose SLIs for end-to-end latency, error-rate, and replay readiness. How do you validate your end-to-end SLA? Create synthetic traffic that exercises worst-case partitioning, simulate producer version skew, and run chaos tests that kill consumers and validate clean replay semantics. When you treat real-time streaming ingestion pipelines as a coherent engineering product—with contracts, partitioning, delivery semantics, late-data strategies, and operational playbooks—you unlock continuous feature computation and low-latency decisioning without accumulating technical debt.
Integrating Machine Learning and Model Serving
Building on this foundation, integrating model serving with machine learning pipelines is the practical step that converts analytics signals into automated action and value. We need model serving, real-time inference, and a consistent feature store to be first-class citizens of the platform so you can score events sub-second, preserve lineage, and trigger downstream actuators. If your platform still treats models as offline artifacts, you’ll face inference lag, feature mismatch, and brittle retraining cycles; integrating serving and model lifecycle mitigates those risks and unlocks continuous delivery for ML.
The first engineering rule is to separate offline training from online serving while preserving a single source of truth for features. A feature store provides that contract: offline feature computation for reproducible training datasets and online feature serving for low-latency lookups. When we design pipelines, we compute and materialize the same transformations to both offline jobs and the online layer, serialize schemas, and attach lineage metadata so predictions carry the exact feature versions used at training time. This avoids the classic offline-online skew that causes silent accuracy degradation in production.
For serving topology, choose the simplest model that meets your SLA and scale requirements: synchronous RPC for tight SLAs, asynchronous queues for heavy or batched models, and edge-embedded runtimes for ultra-low-latency decisions. Implement a lightweight prediction API that validates input, fetches online features, joins them with the request payload, and calls the model runtime; a minimal pattern looks like POST /predict -> fetch(features, user_id) -> model.predict(features) -> return(score, metadata). Keep the serving layer stateless where possible and push caching and cold-start mitigations to the edge to reduce tail latency.
Consistency and freshness of features are operational priorities you must instrument for. Always attach a feature-version stamp and event timestamp to each prediction so you can replay or backfill deterministically; when a stale cache returns an older feature vector, downstream decisions will diverge from what you intended. Use TTLs for cached feature vectors, fallback flows for missing keys, and hybrid lookups (fast KV cache with a read-through to a compacted topic or key-value store) to balance cost and latency. These techniques prevent the mismatch between what your model was trained on and what it sees in production.
Observability and governance are non-negotiable: log every inference with input features, model version, latency percentile, and a unique trace id so you can compute drift metrics, slice performance by cohort, and automate retrain triggers. How do you detect model drift before it affects customers? Instrument input/output distributions and use divergence metrics (KL, PSI, or Wasserstein) against the training baseline; alert on sustained deviation and kick off a reproducible retraining workflow that includes data validation and lineage checks. Recording labels or proxies for labels back into the lakehouse closes the loop for supervised retraining and auditability.
Operational patterns matter: autoscale model replicas by p99 latency and queue depth, batch requests for GPU-based models to increase utilization, and use shadowing and canary deployments to evaluate new model behavior without impacting traffic. When throughput is high and latency can tolerate batching, prefer asynchronous inference with an idempotent response sink; when you need sub-50ms decisions, pick a compact runtime (ONNX/TVM) with local caching and bring-your-own model-accelerator strategy. For governance, enforce model registries that record provenance, validation tests, and approved rollout stages so rollbacks and audits are deterministic.
Taking these pieces together, integrating machine learning and model serving transforms your platform from descriptive dashboards into an operational decision engine. We make serving predictable by enforcing feature contracts, instrumenting every inference, and choosing the right serving topology for your SLA. Next, we’ll examine how orchestration and observability tie these operational practices into reproducible retraining and continuous delivery for models.
Ensuring Scalability and Orchestration Across Clusters
When your platform needs to scale beyond a single control plane, the hard part isn’t adding nodes — it’s preserving predictable scalability, orchestration, and operational consistency across clusters. How do you ensure consistent scaling and orchestration across many clusters without introducing cascading failure or management complexity? Start by treating multi-cluster architecture as an engineering product: define the control plane responsibilities, the data plane responsibilities, and the failure domains up front so you can reason about capacity, latency, and compliance trade-offs rather than reacting to incidents.
Building on the ingestion, stream processing, and serving primitives we’ve already covered, decide which workloads require global consistency versus locality. Put latency-sensitive model serving, feature lookups, and tenant-critical state in regional clusters close to users; place heavy batch training, long-term archives, and cost-optimized compute in separate clusters or cloud regions. This separation reduces cross-cluster chatter, limits blast radius during updates, and gives you deterministic scalability characteristics for operational SLAs. For many teams, a hybrid pattern — multiple regional clusters plus a global management/control cluster — balances performance, cost, and governance.
Make orchestration declarative and idempotent so you can reason about changes consistently across clusters. Use GitOps as the single source of truth for deployments, operators, and configuration; a single PR should be able to push identical manifests to a staging cluster and then promote them to production clusters. Combine Kubernetes primitives (Namespaces, StatefulSets, Deployments) with custom controllers and operators to encapsulate platform logic — for example, an operator that enforces feature-store sharding and backfill jobs. Autoscaling should be multi-layered: horizontal pod autoscaling for request-driven microservices, vertical autoscaling for memory-bound processes, and cluster autoscaler for node-level elasticity; consider event-driven scaling with KEDA for stream-consumer elasticity. Example HPA manifest pattern you can reuse looks like this:
apiVersion: autoscaling/v2
kind: HorizontalPodAutoscaler
metadata:
  name: model-serving-hpa
spec:
  scaleTargetRef:
    apiVersion: apps/v1
    kind: Deployment
    name: model-serving
  minReplicas: 2
  maxReplicas: 50
  metrics:
  - type: Resource
    resource:
      name: cpu
      target:
        type: Utilization
        averageUtilization: 70
Stateful services and storage present the biggest orchestration challenges across clusters. For low-latency feature lookups, use local KV stores (Redis, RocksDB-backed stores) per cluster and replicate asynchronously to a global durable store for training and forensics; avoid synchronous cross-cluster calls for hot paths. For durable streaming, partition topics (Kafka or cloud-native equivalents) with locality in mind and use cross-cluster replication for resilience and disaster recovery. When you need cross-cluster consistency, choose explicit patterns like leader election per shard or CRDTs where eventual consistency is acceptable; rely on transactional sinks and replayable logs to rehydrate state during recovery or backfill.
Observability and policy enforcement are the glue that let orchestration scale reliably. Centralize telemetry ingestion (Prometheus remote_write, distributed tracing collectors, log aggregation) so you can compute cross-cluster SLIs and detect systemic issues early. Automate guardrails: policy-as-code for network and RBAC, automated certificate renewal, and admission controllers that block unsafe configurations. Use canary and shadowing deployments across a subset of clusters to validate performance and drift before global rollout; reconcile differences automatically and surface exceptions to engineers rather than letting silent divergences fester.
Operational discipline reduces cognitive load as you scale. Standardize deployment pipelines, enforce schema and feature contracts, and codify runbooks for cross-cluster failures (partial network partitions, control-plane throttling, or cloud region failures). Secure multi-cluster networking with zero-trust primitives, and centralize secrets and identity providers so policy is consistent. Taking these steps preserves scalability and orchestration at scale: you gain predictable capacity planning, safer rollouts, and a platform that lets teams iterate on models and analytics without recreating operational complexity in every cluster.
Observability, Governance, and Data Privacy
Building on this foundation, the reliability of an AI-driven analytics platform depends less on dashboards and more on end-to-end instrumentation, policy, and privacy controls that you can trust under load. Observability, data governance, and data privacy are not optional add-ons; they are the operational contracts that let you run continuous feature computation, low-latency model serving, and reproducible retraining without surprising downstream consumers. If you treat these concerns as separate, ad-hoc chores, you’ll accumulate technical debt that surfaces as silent model drift, audit failures, or user-facing breaches.
Observability means making hidden state visible across data and model pipelines so we can answer both operational and analytical questions quickly. At the data-plane level that means tracing events from producer to sink, emitting schema versions and trace ids with every message, and measuring SLIs like event-lag, processing-latency, and completeness. For models, observability covers prediction latencies, input/output distributions, and per-cohort error metrics; capturing these with correlated traces lets you pivot from an alert to a root cause within minutes rather than hours. How do you detect model drift before it affects customers? Instrument input distributions and compute divergence metrics against training baselines, then treat sustained deviation as a first-class signal to trigger investigation or retraining.
Make observability actionable with concrete patterns you can implement today. Emit a compact inference record for every prediction that includes feature-version, model-version, request-timestamp, and a trace id; store these in a compact append-only topic for efficient backfill. For example, a minimal log line looks like: {"user_id":..., "feat_v": "v2.14", "model_v": "2026-03-01", "score":0.87, "trace_id": "..."} — that record lets you recompute cohort performance, replay inputs, and verify lineage without guessing which features were used. Correlate these records with infrastructure metrics and alert on p99 latency shifts, feature-cardinality explosions, or missing-partition errors so your incident runbooks can be precise and reproducible.
Data governance is the policy and metadata layer that makes those observability signals trustworthy and auditable. Define canonical schemas in a registry with compatibility rules, enforce producer-side validation, and require lineage metadata on all materialized artifacts (features, models, derived tables). Model governance extends this: a model registry should record training datasets, feature-versions, validation results, and approved rollout stages so you can reproduce production scores and meet audit requirements. In practice, governance saves time during compliance or incident investigations—when an auditor asks which feature version produced a decision, you can return a deterministic, time-stamped chain rather than reconstructing it from memory.
Data privacy must be engineered into pipelines rather than bolted on afterward. Start with data minimization—store the least-identifying information necessary for the use case—and apply strong access controls, encryption-at-rest and in-transit, and tokenization for PII. For personalization that requires user-level signals, use differential privacy or secure aggregation where appropriate, and consider federated learning or edge inference when raw telemetry cannot leave a device. Operationally, enforce TTLs and automatic purging for hot caches and online feature stores so stale personal data doesn’t linger in low-latency paths.
Bringing these concerns together requires automated policy-as-code embedded in your orchestration layer. Gate backfills, retraining jobs, and deployment promotions on automated compliance checks: schema-validation, data-quality thresholds, privacy-scans, and lineage completeness. Use the feature store as the policy enforcement point—require schema stamps, access policies, and TTLs to be present before a feature is served online; when a compliance check fails, fail fast and surface diagnostic traces to the owning team. This reduces manual approvals and scales governance as your platform grows.
Taking these engineering patterns forward, we make AI-driven analytics operationally safe and auditable by design. Observability gives you the signals, governance gives you the contracts, and privacy gives you the guardrails; together they let us run continuous feature computation, serve models with confidence, and iterate without creating regulatory or operational debt. Building on this foundation, the next area to address is how orchestration and cross-cluster scaling enforce these contracts in production at scale.