Understanding SQL Performance Bottlenecks
In the realm of SQL databases, performance bottlenecks are impediments that slow down query execution and overall database responsiveness. Identifying and understanding these bottlenecks is crucial for optimizing performance and ensuring efficient data handling.
One primary source of bottlenecks is poorly written queries. When a query is not optimized, it can lead to excessive computation times and increased server loads. Consider a scenario where a query retrieves data from a large table without appropriate filtering mechanisms, such as using indexes or WHERE clauses. The database engine may end up performing a full table scan, examining every row instead of efficiently retrieving the desired subset. This can be mitigated by examining query execution plans, which provide insights into how a database processes a query. By analyzing these plans, developers can identify inefficient joins, missing indexes, or unnecessary operations.
Another common bottleneck involves inadequate indexing strategies. Indexes are vital for rapid data retrieval, but incorrect or redundant indexes can incur additional overhead during data writing operations, such as INSERTs or UPDATEs. A balance must be struck where indexes enhance read performance without significantly hindering write operations. For example, creating a composite index, which covers multiple columns used together in queries, can optimize access patterns that improve read efficiency while minimizing index maintenance overhead.
Locking and blocking behavior is another critical bottleneck. Lock contention arises when multiple transactions compete for the same resources, leading to delays. To minimize these effects, it’s important to fine-tune the isolation levels of transactions to balance between consistency and performance. Optimistic locking is a technique where data is read with minimal locks, and conflicts are only checked when writing, reducing the blocking.
Hardware limitations can also contribute to performance bottlenecks. Insufficient CPU, memory, or disk I/O capabilities can constrain how efficiently the database processes queries. Implementing hardware solutions like SSDs for faster data access, adding more RAM, or utilizing multi-core processors can alleviate these constraints. Additionally, proper configuration of the database server, matching settings such as buffer pool size to the available memory, can significantly enhance performance.
Network latency is another factor that can cause bottlenecks, especially in distributed database systems where data is spread across multiple servers. Reducing the distance over which data must travel, using private networks with reduced latency, and optimizing the way data is transmitted—by batching smaller queries into larger transactions—can improve response times.
Lastly, regular database maintenance tasks such as updating statistics, reindexing, and purging obsolete data are essential for minimizing performance bottlenecks. Automated scripts and scheduled tasks can help maintain optimal database conditions, ensuring the backend infrastructure supports the demands placed upon it effectively.
By systematically identifying and addressing these potential bottlenecks, database administrators and developers can significantly enhance the performance of SQL databases, leading to more efficient and responsive applications.
Implementing Effective Indexing Strategies
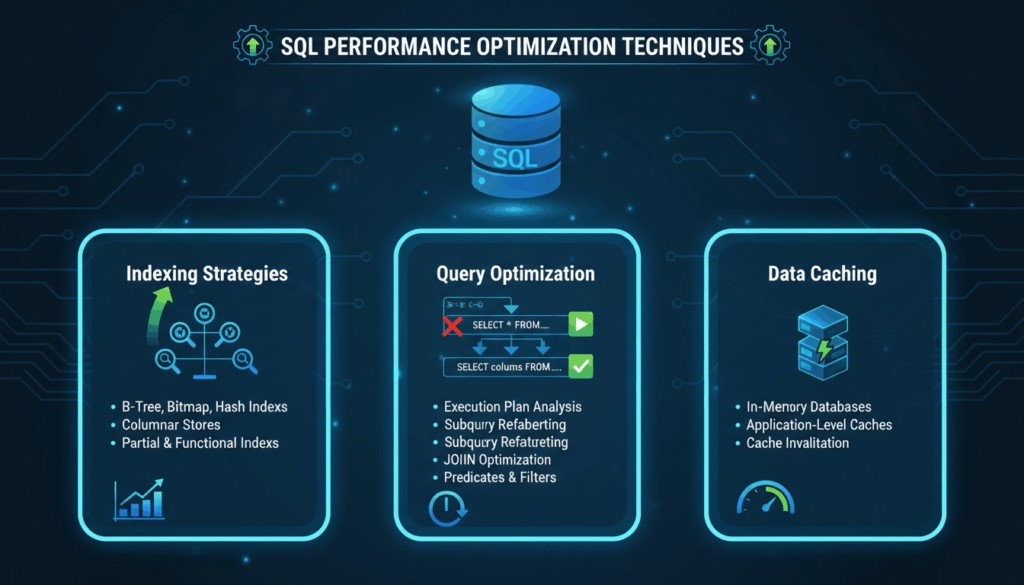
An effective indexing strategy is a cornerstone of performance optimization in SQL databases. Indexes can dramatically improve query performance by reducing the amount of data that needs to be scanned. Here’s how you can implement an effective indexing strategy, focusing on key techniques and considerations.
Preparation involves understanding the data model and query patterns. Begin by reviewing your database schema to identify tables and columns frequently involved in WHERE clauses, JOIN operations, and aggregations. Profiling your queries using tools like EXPLAIN or EXPLAIN ANALYZE can reveal which queries will benefit most from indexing. These tools display execution plans that show how a query will be executed, highlighting bottlenecks related to data access paths.
Single-Column Indexes
Single-column indexes are the simplest form of indexing, applied to individual columns often used in isolation in query filters. For example, if a table contains a customer_id that frequently appears in SELECT queries’ WHERE clauses, creating an index on customer_id can drastically improve query retrieval times by eliminating full table scans.
Composite Indexes
Composite indexes, covering multiple columns, come into play when queries filter or sort data using multiple fields. For example, in a sales database, queries that filter by product_id and sale_date could be optimized using a composite index on these columns. The order of columns in a composite index is crucial and should reflect their order in query predicates, optimizing search paths based on the most selective column statistics.
Partial Indexes
Partial indexes are a potent optimization by indexing only a subset of data within a table. These are particularly useful for indexing columns with a predicate. For example, if queries often filter for active users, an index with a WHERE clause on status = 'active' will save space and overhead by excluding irrelevant data.
Covering Indexes
A covering index contains all the columns needed to satisfy a query, allowing it to be fulfilled entirely from the index without accessing the table. This is particularly effective in read-heavy environments, where minimizing I/O can significantly improve performance. For example, an index on customer_id, order_date, and total in a SELECT query with these columns allows the database to fetch results directly from the index.
Regular Maintenance and Analysis
Regular maintenance of indexes is crucial. This involves monitoring changes in query patterns and data distributions. Over time, some indexes may become obsolete while others may require creation as new queries emerge. Tools like query profilers and the auto_explain module in PostgreSQL help continuously analyze and suggest needed indexes.
Additionally, keep an eye on index bloat and fragmentation. Indexes can grow disproportionately to the underlying data as deletes and updates occur. Periodically rebuilding or reindexing can compact indexes and restore efficient access pathways.
Balancing Read and Write Performance
Remember that indexes speed up retrievals but can slow down write operations like INSERTs, UPDATEs, and DELETEs due to the overhead of maintaining the index. Striking a balance requires analyzing your workload patterns. In dynamic environments where data writes are frequent, consider consolidating indexes or selectively delaying index updates during high-transaction periods.
Automatic and Adaptive Indexing
Leverage database functionalities that suggest indexes based on query performance analysis. For example, SQL Server’s Database Engine Tuning Advisor or MySQL’s Performance Schema offer insights into suggested indexes which can be implemented or tweaked according to needs.
Implementing these indexing strategies requires contextual understanding and a proactive approach towards monitoring dynamic database usage patterns. The goal is not only to enhance current performance but also to adapt to evolving data access requirements.
Optimizing Query Structures and Joins
Effective SQL query optimization can significantly enhance database performance. One of the foundational techniques is structuring queries and joins efficiently to minimize execution times and resource usage.
The first step in optimizing query structures involves analyzing how SQL queries interact with the underlying database schema. Queries should be written to take advantage of indexes, especially when dealing with large datasets. Utilizing indexed columns in your WHERE clause can reduce the data scanned by the database engine, resulting in faster execution times. Avoid using functions on columns that are part of an index because they prevent the use of the index, leading to slower performance.
An understanding of SQL execution plans is critical in optimizing query structures. By using tools like EXPLAIN in MySQL or EXPLAIN QUERY PLAN in SQLite, you can inspect the execution plan generated by the database engine. These tools offer insights into whether indexes are used, the sequence of table scans, and how data is fetched. It’s crucial to identify and address full table scans and unnecessary loops in the execution plan.
Efficient use of joins is another key aspect of query optimization. Considering the join type is essential:
- INNER JOIN: Retrieves records with matching values in both tables. This join is efficient when matched rows are needed.
- LEFT JOIN: Retrieves all records from the left table, and the matched records from the right table. Be cautious with LEFT JOIN when a significant portion of unmatched rows will be returned, as this can inflate the dataset being processed.
- RIGHT JOIN: Less commonly used but similarly retrieves all records from the right table and matched records from the left.
Prefer join operations over subqueries whenever possible. Joins are generally more straightforward and easier for the SQL engine to optimize. For example, if you need data from two tables where a foreign key relationship exists, a JOIN typically performs better than a nested subquery.
Ordering and grouping operations can be expensive in terms of performance. Apply filters before GROUP BY and ensure that the columns used in ORDER BY and GROUP BY clauses are indexed appropriately. This encourages the database to perform these actions more efficiently by leveraging the index for sorting and grouping operations.
Example:
Consider two tables, orders and customers, with orders.customer_id as a foreign key:
SELECT c.name, COUNT(o.order_id) AS order_count
FROM customers c
JOIN orders o ON c.customer_id = o.customer_id
WHERE o.order_date > '2023-01-01'
GROUP BY c.name
ORDER BY order_count DESC;
In this query, we join customers with orders using a foreign key relation. We filter orders by date before performing groups and sorts, ensuring efficiency. By placing an index on orders.order_date, database performance is enhanced as it eliminates the need for full table scans.
By adopting these practices, SQL queries can be structured to achieve maximum performance, reduce response times, and efficiently utilize resources. Alongside this, ongoing monitoring and adjustments based on query performance metrics ensure sustained optimization in a dynamically changing database environment.
Utilizing Execution Plans for Performance Tuning
Execution plans are a critical tool for performance tuning in SQL databases, providing detailed insights into how queries are executed by the database engine. Understanding and utilizing execution plans enables database administrators and developers to pinpoint inefficiencies, optimize query performance, and improve overall database responsiveness.
When a query is executed, the database engine determines the most efficient way to retrieve the requested data. This process involves choosing whether to use indexes, which join strategies to employ, and how to order the execution of different operations. Execution plans represent these decisions in a detailed, hierarchical structure that showcases each step the engine will take.
To access an execution plan, you can use specific commands and tools provided by your database management system. For instance, in MySQL, you use EXPLAIN or EXPLAIN ANALYZE before your query to view a textual representation of the execution plan. In PostgreSQL, EXPLAIN provides similar insights, with additional options like EXPLAIN (ANALYZE, BUFFERS) offering more detailed statistics about buffer usage and execution time.
Key Components of Execution Plans
-
Sequential Scan vs. Index Scan: Execution plans reveal whether the database will perform a sequential scan, checking every row, or an index scan, retrieving only the rows needed. An index scan is preferable for large datasets, as it significantly reduces I/O operations.
-
Join Methods: Different join strategies, such as nested loop, hash join, and merge join, are executed based on the data volume and indexing. Execution plans show which method is chosen, allowing you to modify queries or indexes to encourage more efficient join operations.
-
Filter Operations: Execution plans display filter conditions applied at different stages of execution. Identifying filters applied later in the execution process can highlight opportunities to re-order operations or add indexing to improve performance.
-
Cost Estimates: These numerical estimates suggest the resource consumption expected from executing various parts of the plan. It helps prioritize which operations to optimize first.
Optimizing Performance using Execution Plans
Step 1: Review the Execution Plan
Start by generating an execution plan for the query in question. Pay attention to the order of operations, the tables accessed, the join types used, and the application of indexes. Look for any full table scans or expensive operations.
Step 2: Identify Bottlenecks
Focus on areas with high cost estimates or inefficient operations, like full table scans where an index could be used. Note any sequential scans where index scans are expected, potentially indicating missing indexes.
Step 3: Modify Queries or Schemas
Based on the insights, adjustments can be made. Introduce or adjust indexes on columns that appear frequently in WHERE clauses and join conditions. Simplify queries to eliminate unnecessary computations and optimize join orders based on data distributions.
Step 4: Iterate and Test
Optimize by incrementally altering the query or schema and regenerating the execution plan. Confirm improvements by comparing cost estimates and execution times.
Examples
Consider a query that fetches orders from a database:
SELECT customer_id, order_total
FROM orders
WHERE order_date > '2023-01-01'
ORDER BY order_total DESC;
If the execution plan shows a full table scan, adding an index on order_date can optimize performance:
CREATE INDEX idx_order_date ON orders(order_date);
Re-analyze the plan post-indexing to confirm that the expected index scan is now in place, reducing resource consumption.
Execution plans are not static; as databases evolve, query patterns change, and data grows, regular review and tuning based on execution plans are essential for maintaining optimized performance. This proactive approach ensures that applications remain responsive even under increased loads or changing access patterns.
Leveraging Caching Mechanisms to Reduce Load
Caching mechanisms are indispensable tools for enhancing SQL database performance, particularly in environments where data requests are frequent and resource-intensive. By temporarily storing query results, caching reduces the need to repeatedly access the underlying data, thereby significantly decreasing server load and improving response times.
By minimizing the frequency of direct database access, caching conserves computational resources and optimizes overall system performance. Leveraging these mechanisms thoughtfully can transform the efficiency of data retrieval processes and offer a seamless experience for end-users.
The most common types of caching mechanisms are in-memory caching and query result caching, each with distinct advantages and applications:
In-Memory Caching
In-memory caching involves temporarily storing data in system memory (RAM), allowing for rapid access compared to disk storage. Tools like Redis and Memcached are popular solutions in this space, offering robust features for data persistence and scalability.
Setting Up In-Memory Caching:
- Choose a Caching Tool: Depending on your requirements, decide between an in-memory data structure store like Redis or Memcached. Both are highly performant but offer different persistence and replication features.
- Configure Memory Allocation: Ensure that the chosen cache has sufficient memory allocated to store frequent query results or entire databases as needed.
- Integrate with Your Application: Use the caching library compatible with your SQL database and application framework, which usually consists of a light-weight API integration for caching and retrieving data.
- Define Caching Rules: Establish rules for which data to cache, such as frequent queries or highly requested records. Program cache expiration to prevent stale data.
Example:
In an e-commerce application, caching the result of commonly accessed product details can offload query requests from your SQL database, thereby enhancing performance. For instance, when a product page is requested, first check the cache for details and, if unavailable, query the SQL database, store the result in the cache, and serve it to the user.
Query Result Caching
Another effective approach is query result caching, where the database automatically stores the results of a query for subsequent requests. This practice is common in data-intensive applications where identical queries are frequent.
Implementing Query Caching:
- Database Configuration: Enable query cache in your database system. For example, in MySQL, you can enable query cache by setting
query_cache_typetoON. - Query Tuning: Regularly analyze queries to ensure they are optimal for caching. Alter query structures to maximize the cache hit rate, avoiding functions or variables that could cause frequent changes.
- Cache Management: Set the cache size appropriately in configuration settings (e.g.,
query_cache_sizein MySQL) to balance between memory usage and the cache’s capability to store query results. - Monitor and Adjust: Use database monitoring tools to track the cache hit rate and adjust the cache settings as needed to improve performance.
Example:
Consider a real estate platform where users frequently search for properties in specific locations. By caching these query results, you can prevent repetitive full dataset scans and reduce load, thus serving users promptly with visible listings.
Best Practices
- Balance Caching and Complexity: While caching can reduce load, excessive use of complex caching logic can lead to debugging challenges and increased latency during cache population. Keep the caching logic simple and transparent.
- Strategize Cache Expiry: Carefully determine cache expiration times to balance freshness with performance. Stale data can lead to inconsistencies, especially in dynamic environments.
- Data Consistency and Coherency: Establish policies and mechanisms to invalidate caches promptly upon data updates, ensuring that the cached data remains consistent with the database.
Conclusion
Integrating caching mechanisms into your SQL system is a strategic decision that can noticeably enhance database performance. With the correct setup and ongoing management, caching can minimize database workload, improve response time, and create a more efficient but robust database environment. Regular assessment of caching strategies and configurations ensures sustained performance gains as system demands evolve.


