Connect Live Sports Data to Your March Madness Dashboard: Real-Time NCAA Basketball Data Visualization Guide
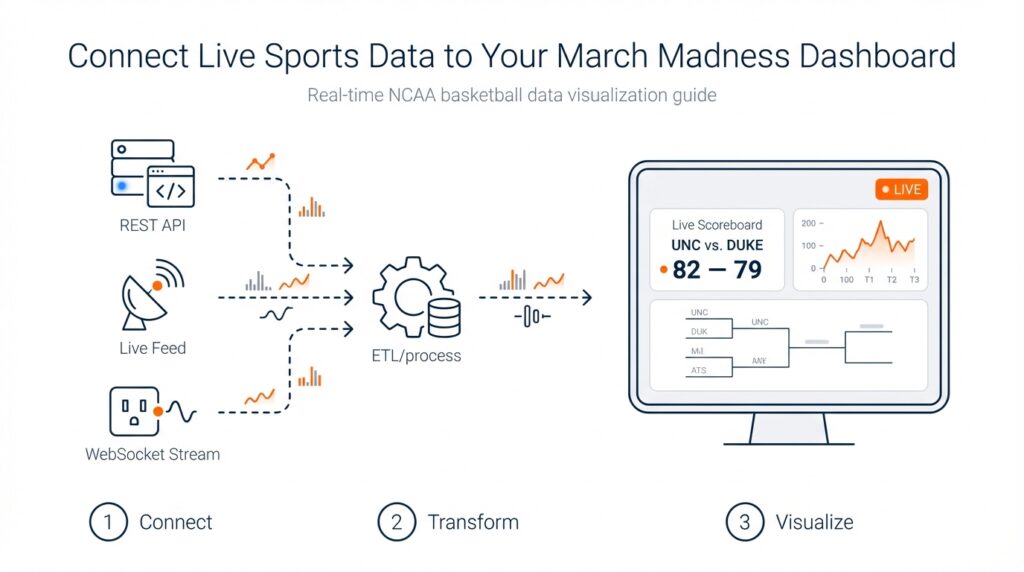
Define dashboard goals and metrics Imagine you’re staring at a blank canvas for your March Madness dashboard, the clock ticking […]
Define dashboard goals and metrics Imagine you’re staring at a blank canvas for your March Madness dashboard, the clock ticking […]
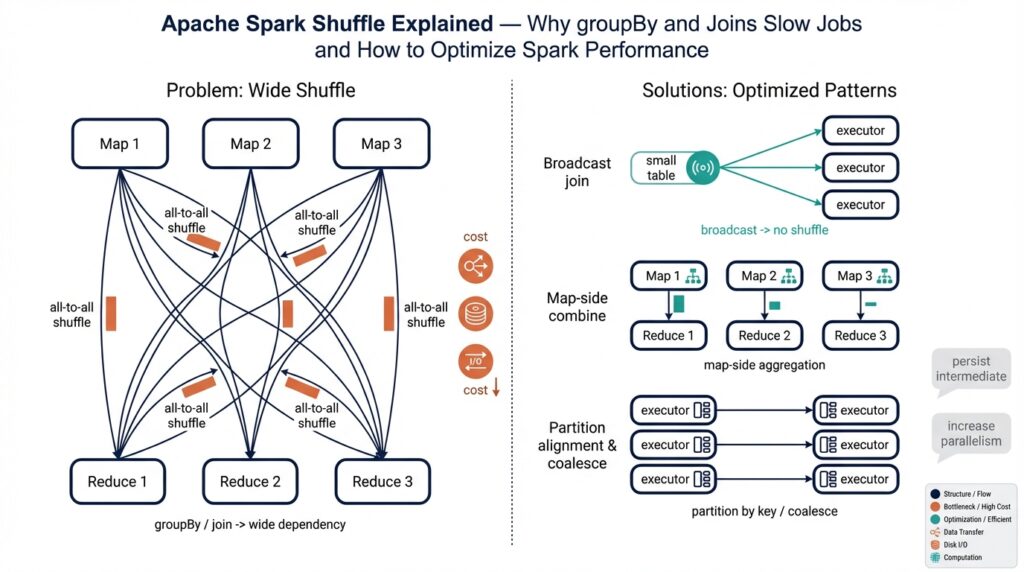
What is Spark shuffle? Imagine you just ran a groupBy and watched your Spark job stall — you’re not alone.
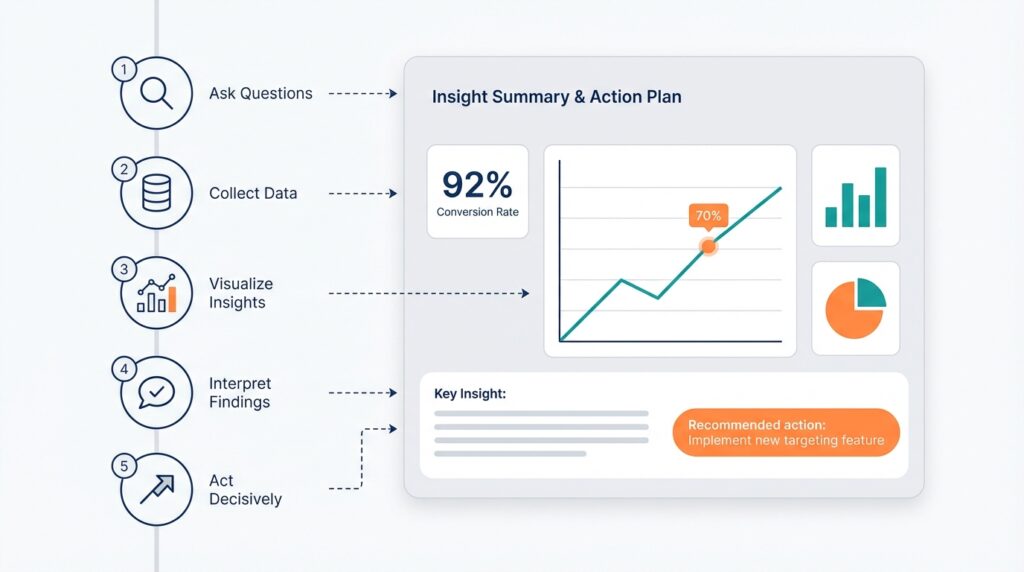
Define purpose and audience Imagine you’ve collected a pile of charts from your analytics tools and you’re staring at them
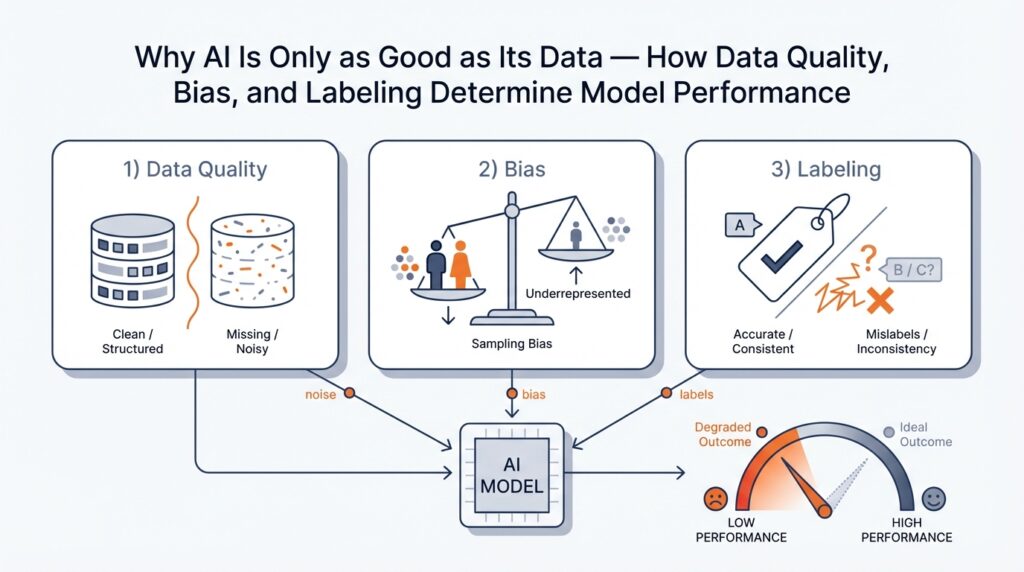
Why Data Quality Determines Model Success Imagine you’ve just trained a shiny new model and you’re excited to test it
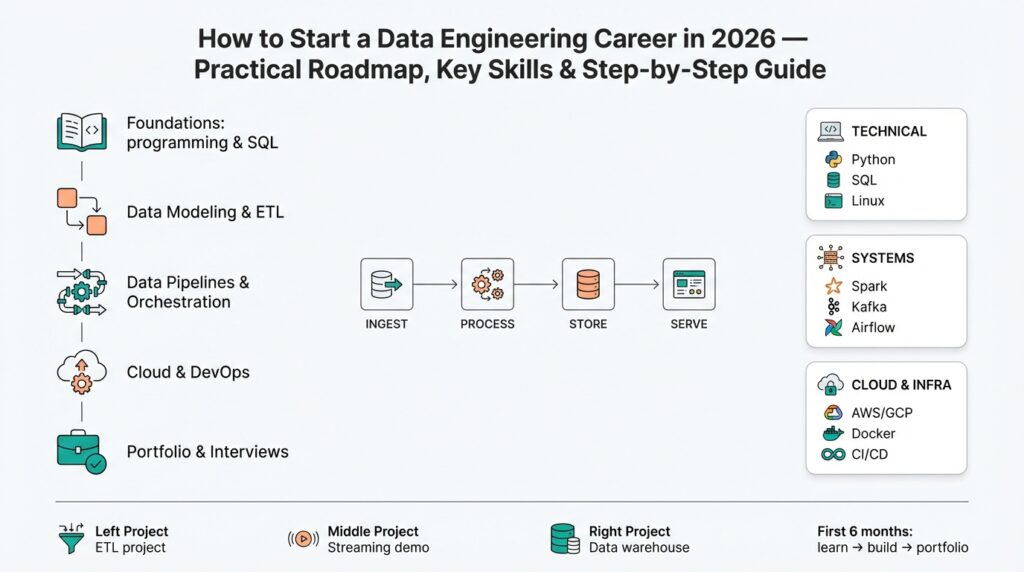
Why Data Engineering in 2026 Imagine you just opened your inbox and your product manager asks, “Can we start making

SELECT and WHERE basics Imagine you’ve opened a dataset and feel a little overwhelmed by rows and columns — where
Top 5 Essential SQL Queries Every Data Analyst Must Know (Examples & Best Practices) Read More »
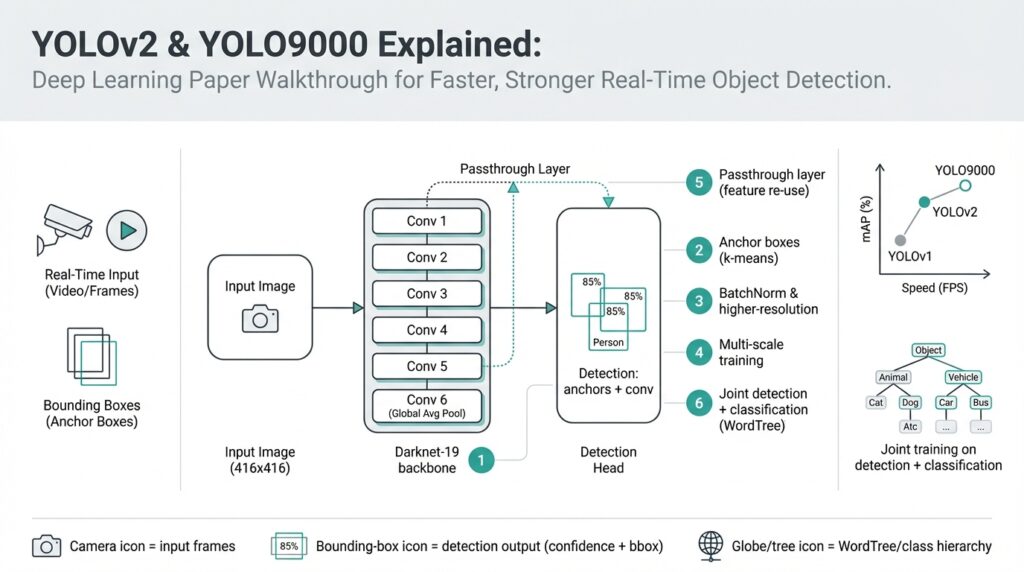
YOLOv2 and YOLO9000: Paper Overview Imagine you’ve been playing with toy object detectors and you want something that runs fast
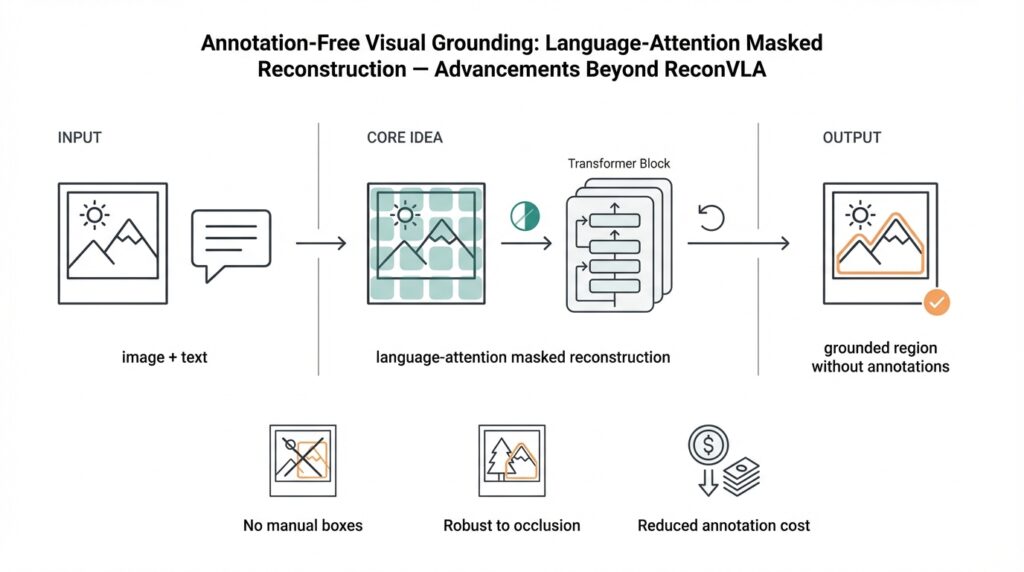
Annotation-free visual grounding overview Imagine you just finished reading about the limits of boxed annotations and felt frustrated by how
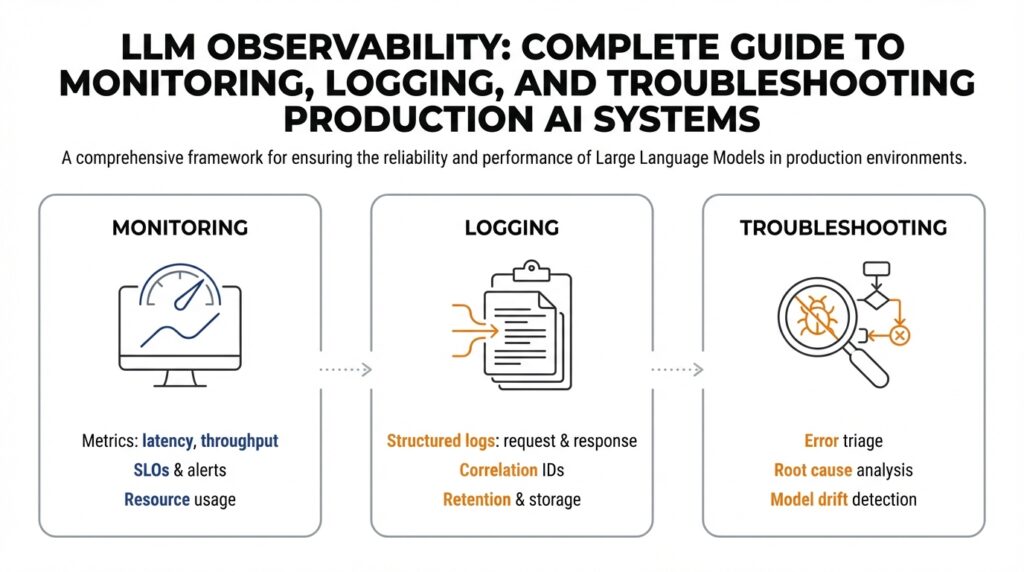
What is LLM observability Imagine you just pushed an LLM-powered feature to users and, overnight, some responses start making no