Understand conversational AI latency: types (network, compute, model) and user impact
Every extra 100–300 ms in a conversational flow noticeably reduces perceived responsiveness and user satisfaction.
- Network — round‑trip time between client and server (mobile or poor Wi‑Fi increases delays). User impact: slow session starts, typing lag, dropped interactions.
- Compute — inference and queuing time on CPU/GPU (concurrency and batching matter). User impact: inconsistent response times, visible pauses.
- Model — model size, decoder algorithm, and per‑token compute affect generation speed. User impact: long replies, truncated exchanges, higher token latency costs.
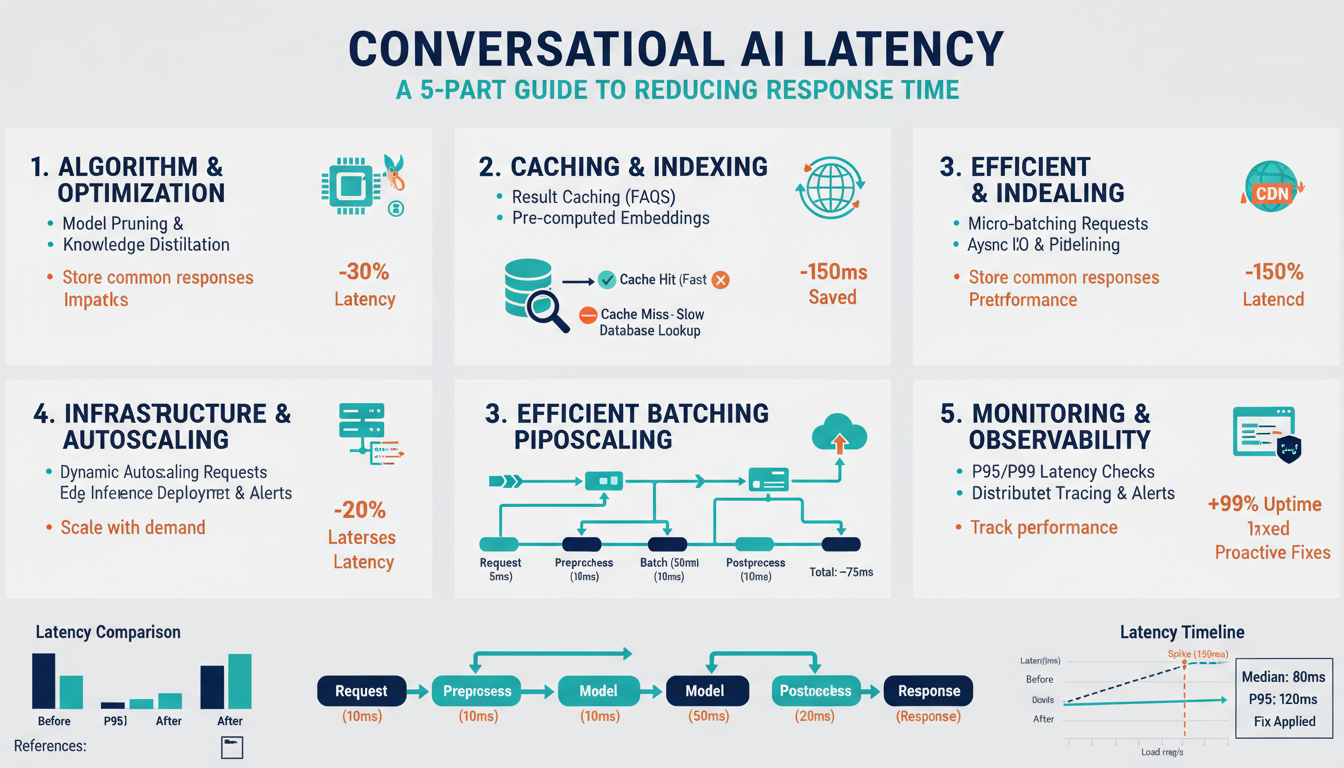
Measure end‑to‑end RTT, per‑token latency, and tail metrics (p95/p99) to capture real user experience. Small operational changes—edge routing, request batching, model quantization, or faster decoders—often produce the biggest perceived improvements.
Measure and profile latency: define SLOs, p50/p90/p99, and use profiling tools (torch profiler, NVIDIA Nsight, Prometheus/Jaeger)
Define SLOs in user‑centric terms (e.g., 90% of requests < 300 ms, 99% < 1 s). Measure both end‑to‑end RTT and per‑token latency, and separate network, queuing, and inference times.
Report p50/p90/p99 percentiles: p50 = typical UX, p90 = common slowdowns, p99 = tail incidents you must fix. Use histograms (not averages) so percentiles are accurate.
Instrument and observe:
– Prometheus: export histograms/summaries for request, queue, and token latencies.
– Jaeger: capture distributed traces to attribute delays across services and network.
– torch.profiler: profile per‑operator CPU/GPU time and memory during inference.
– NVIDIA Nsight: inspect GPU kernels, memory transfers, and stalls.
Workflow: set an SLO, collect metrics, identify offending percentile (e.g., p99), run profiler/traces to find hot operators or I/O bottlenecks, apply fixes (batching, quantization, async I/O), and remeasure. Automate alerts on SLO breaches.
Optimize the model: pruning, quantization (FP16/INT8/FP8), and knowledge distillation
Start by measuring accuracy vs latency tradeoffs on a validation set and set targets (p50/p90/p99 + quality delta).
-
Pruning: prefer structured (filter/channel) pruning for real speedups on accelerators; use unstructured when storage matters. Aim for 20–40% sparsity, then fine‑tune to recover accuracy. Validate per‑token latency after sparsification.
-
Quantization: FP16 (mixed precision/AMP) is low risk and yields immediate throughput gains. INT8 gives larger memory and throughput wins—use per‑channel weight quantization, activation calibration or quantization‑aware training (QAT) if accuracy drops. FP8 can further compress on supported hardware but requires careful QAT and vendor libs.
-
Knowledge distillation: train a smaller student using teacher logits + sequence‑level loss (CE + KL) and targeted fine‑tuning on hard examples to retain behavior while reducing compute.
-
Practical flow: prune → fine‑tune → (distill) → quantize → QAT if needed. Remeasure SLOs and quality metrics after each step and keep rollback checkpoints.
Improve inference throughput: batching strategies (static/dynamic/microbatching), KV caching, and speculative decoding
Use batching to trade latency for throughput:
- Static batching: fixed batch size—easy to implement, highest GPU utilization under steady load but increases tail latency for single requests.
- Dynamic batching: accumulate requests up to max_batch or max_wait_ms (small time window) to improve p99 without blocking long; tune window and max_batch per traffic profile.
- Microbatching: split large requests or long sequences into smaller chunks to pipeline compute, overlap host↔device transfers, and keep kernels busy.
KV caching: persist per‑token key/value tensors during autoregressive decoding to avoid recomputing past attention. Store caches in fp16/quantized formats, shard across devices for very long contexts, and implement sliding-window eviction to bound memory.
Speculative decoding: run a lightweight proposer to generate token candidates and verify them with the heavy model in parallel. Accept proposals when verifier confidence (top‑k/logit agreement) passes; otherwise fall back to full decoding. Measure quality vs latency and include conservative fallbacks to prevent hallucination.
Always profile throughput/latency tradeoffs (p50/p90/p99) when tuning these knobs.
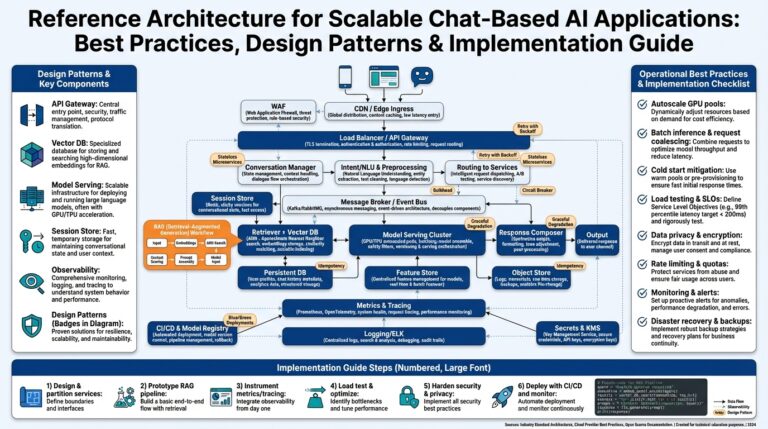
Design low-latency infrastructure: GPU/TPU choices, edge vs cloud, warm pools, autoscaling and request routing
Match accelerator to workload: favor GPUs with strong single‑stream latency and fast interconnects (for low‑latency single-user inference) and multi‑GPU/TPU clusters for very large, sharded models or high sustained throughput. Quantize and shard where possible to fit warm models into GPU/TPU memory.
Place compute by RTT and model size: run compact, quantized models at the edge or regional PoPs to minimize network latency; keep heavyweight models in cloud regions with GPU/TPU capacity and fast regional peering. Use a hybrid pattern—edge for first‑pass replies, cloud for full‑quality generation.
Keep warm pools of preloaded model processes/containers with loaded weights and initialized GPU contexts to eliminate cold start costs; size pools by traffic percentiles and precreate GPU memory allocations.
Autoscale using latency and queue signals (p95/p99 and queue length), with predictive scaling and conservative scale‑in cooldowns to avoid oscillation. Warm startup hooks and prioritized cold‑start queues help smooth transitions.
Route requests by latency and capability: geo/latency aware load balancing, tiered routing to fast distilled models first (speculative serving), and deterministic sticky routing for session locality and KV cache hits.
Application-level strategies and runtime patterns: response caching, token streaming, async processing, admission control and SLO-aware scheduling
Use short-lived response caches for idempotent or repeatable queries (store final answers and partial-generation checkpoints). Cache keys should include model, prompt hash, temperature, and context length; set TTLs to favor freshness and invalidate on user edits.
Stream tokens immediately with small flush thresholds (e.g., 50–200 ms or 1–4 tokens) over HTTP/2, SSE, or WebSocket to reduce perceived latency—batch downstream I/O but keep first-byte fast.
Make inference nonblocking: accept requests, enqueue work, and notify clients via callbacks/webhooks or persistent sockets. Offload expensive postprocessing (summaries, retrieval) to async workers.
Apply admission control using token-bucket/rate limits, priority lanes, and queue-length caps to protect tail latency. Return early fallbacks (shorter model, canned reply) under overload.
Schedule with SLO-awareness: prioritize requests by SLO class, route to fast distilled models when tight, preempt or spill to background processing for noncritical work, and scale using p95/p99 latency and queue metrics.


