Embedded analytics: opportunity and drivers
Embedding analytics inside applications converts passive interfaces into action-oriented products that keep users in-context, reduce friction, and create new monetization or retention levers. Rather than forcing customers to export data or toggle to separate BI tools, in-app analytics deliver immediate insights—personalized reporting, anomaly alerts, and exploratory SQL—where decisions are made.
Several forces are accelerating adoption: user expectations for real-time, contextual insights; the cost and latency of moving large datasets to central warehouses; tighter privacy, residency, and compliance requirements that favor local processing; and developer demand for simpler deployment and lower operational overhead. Architecturally, API-first designs, columnar/vectorized query engines, and durable local storage enable fast, lightweight analytics that scale inside web, mobile, and desktop apps.
From a product perspective, embedded analytics reduces churn by surfacing value earlier, supports feature-led monetization (tiered analytics, premium dashboards), and increases data literacy by exposing non-technical users to interactive metrics. Technically, embeddability benefits from SQL compatibility, low memory footprint, and minimal network egress—qualities that let teams run OLAP-style queries next to application logic without a separate analytics stack.
These combined market and technical drivers make in-application analytics an attractive, practical way to deliver differentiated, data-first user experiences at lower cost and latency than traditional BI pipelines.
Why DuckDB fits embedded workloads
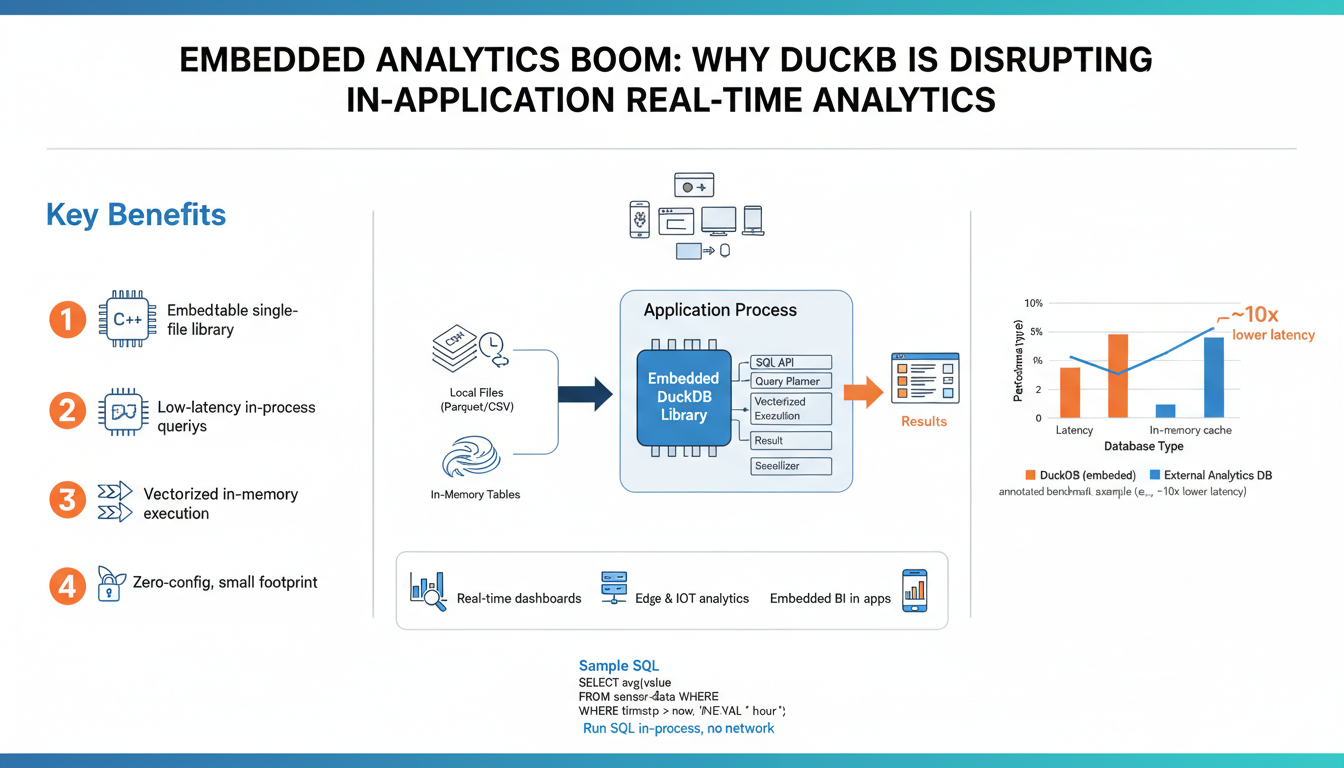
DuckDB’s architecture maps naturally to in-application analytics: it runs in-process as a single-library engine (no separate server), so queries execute in the same runtime as your app with minimal IPC and deployment overhead. Its columnar storage and vectorized execution are built for analytical patterns—fast scans, aggregations and joins on large local datasets—so interactive dashboards and ad‑hoc SQL feel snappy without moving data to an external warehouse.
It also minimizes data plumbing: native support for Parquet and Arrow lets you query files or in-memory tables directly, enabling zero-copy exchanges with host languages and reducing costly serialization or ETL steps. Developers can persist a compact on-disk database when durability is needed or operate entirely in-memory for ephemeral analytics.
Embedding is straightforward because DuckDB is a small, zero‑config C/C++ library with first‑class bindings across common stacks (Python, Node, Go, Java, Rust, etc.), which keeps operational complexity low and security simpler than running a separate analytics service. Predictable resource use, low latency for OLAP-style queries, and tight interoperability with local data make it an efficient choice for real-time, in-application analytics.
DuckDB architecture and key features
DuckDB embeds a full OLAP engine as a single, zero‑config library you link into your application rather than running a separate server. The project ships as a self-contained C/C++ amalgamation with first‑class bindings (Python, R, Node, Java, Go, Rust, WASM), so analytics run in‑process with minimal IPC and deployment overhead. (duckdb.org)
Under the hood it uses columnar storage and a vectorized execution engine optimized for large scans, joins and aggregations; a cost‑based optimizer and parallel operators make interactive SQL queries fast while a bulk‑oriented MVCC implementation provides transactional consistency for persistent databases. These design choices favor OLAP patterns and predictable performance in embedded scenarios. (duckdb.org)
Interoperability is a standout: DuckDB can query Parquet files and Arrow tables directly (for example, you can run queries like SELECT * FROM 'data.parquet' or operate on Arrow RecordBatches) and supports zero‑copy exchanges where possible to avoid costly serialization between host memory and the engine. Extensions for Parquet and Arrow make file‑and‑in‑memory workflows seamless. (duckdb.org)
Storage is flexible: run entirely in‑memory for ephemeral analytics or attach a single on‑disk database file for durability; the engine also spills to disk and exposes tunables (memory_limit, temp directory) to handle larger‑than‑memory workloads gracefully. This combination of low footprint, direct file access, and predictable resource controls makes it well suited for real‑time, in‑application analytics. (duckdb.org)
Integrating DuckDB into your application
Start by selecting the DuckDB binding that matches your stack (Python, Node, Go, Java, Rust, or WASM) and link the single library into your app so queries execute in‑process with minimal IPC. Initialize a connection, choose in‑memory for ephemeral analytics or point to a file for durable storage, and expose a small query API from your application layer rather than embedding raw SQL everywhere.
Example (Python):
import duckdb
con = duckdb.connect('app_data.duckdb')        # use ':memory:' for in-memory
con.execute("CREATE TABLE IF NOT EXISTS events AS SELECT * FROM 'events.parquet'")
rows = con.execute('SELECT user_id, count(*) FROM events GROUP BY user_id').fetchall()
You can query Parquet files or Arrow tables directly to avoid ETL and copying: use SQL against file paths or register Arrow RecordBatches for zero-copy analytics. Persisted DB files are easy to back up (copy file) and support MVCC transactions; for large working sets tune memory limits and temp directories so DuckDB can spill gracefully.
For concurrency, create one connection per thread/process and serialize schema migrations through a single migrator connection. Enforce query timeouts and limits at the app level to prevent expensive ad‑hoc queries from impacting runtime performance. Sandboxing and least-privilege file access reduce security risk when you allow user-supplied SQL.
Bundle the native library with your build pipeline or use the WASM build for browser/edge cases. Add integration tests that run representative queries against sample datasets and include a simple migration and backup strategy (SQL migration scripts + DB-file snapshots) as part of your CI/CD.
Real-time queries and performance tips
Design queries for minimal I/O and predictable latency. Project only the columns you need, push predicates down to Parquet/Arrow sources, and partition files (for example by date) so scans are pruned early. For high‑cardinality or heavy aggregation patterns, maintain small precomputed rollups or materialized summary tables that refresh incrementally instead of re-scanning raw events on every request.
Choose the right storage mode per workload: use an in‑memory DuckDB instance for sub‑second, ephemeral analytics and a persisted DB file for durable state. Tune resource knobs so the engine can spill gracefully—set an appropriate memory limit and temp directory from the host environment and cap query result sizes at the application layer to avoid blocking the main runtime.
Control concurrency and schema work: create one connection per thread/process for parallel reads, but serialize schema migrations and writes through a single migrator connection. Enforce statement timeouts or a query cost budget in the app to prevent long ad‑hoc queries from degrading user‑facing latency. Prefer prepared statements and parameterized SQL for repeated patterns to reduce planning overhead.
Profile and iterate: use EXPLAIN / EXPLAIN ANALYZE to find expensive scans, joins, or sorts. Identify whether bottlenecks are CPU, memory, or disk I/O and act accordingly—more threads for CPU‑bound workloads, better partitioning or column pruning for I/O, and precomputing for repeated aggregates. Cache hot query results at the application level and refresh asynchronously when underlying data changes.
Example pattern: SELECT user_id, COUNT(*) AS cnt FROM events WHERE event_time >= ‘2025-01-01’ GROUP BY user_id ORDER BY cnt DESC LIMIT 100. Measure, optimize, and move expensive transforms to background jobs so interactive paths stay snappy.
Observability, storage, and scaling strategies
Production-grade in‑application analytics needs clear telemetry, predictable storage choices, and scalable operational patterns so queries stay fast without surprising resource usage. Instrument every query at the application boundary with latency, scanned bytes, rows returned, planner time, memory usage and a query-hash; emit structured logs and metrics so slow-query alerts, percentile latency dashboards, and trace correlations are possible. Use EXPLAIN / EXPLAIN ANALYZE for profiling and capture periodic samples of expensive plans to drive optimizations.
Pick storage modes to match SLAs: in‑memory instances for sub‑second ephemeral queries, a single persisted DB file for durable state and compliance, and Parquet/Arrow for bulk, zero‑copy reads. Partition and prune file layouts (date, tenant, or event type) to limit scanned data, maintain compact precomputed rollups or materialized summaries for high‑fanout aggregations, and use incremental Parquet exports or DB-file snapshots as a backup and migration strategy. Tune engine knobs (memory_limit, temp directory) so the engine spills gracefully rather than monopolizing host RAM.
Scale by isolating workloads: one connection per thread/process for parallel reads, a single migrator connection for serialized schema changes, and background workers for heavy ETL or reaggregation. Use per-tenant DB files or shard by logical key to avoid noisy neighbor effects, serve read-only snapshots or exported Parquet files for high-read concurrency, and cache hot results at the app layer. Enforce statement timeouts, result-size caps, and a query cost budget to protect latency-sensitive paths. Monitor system-level CPU, memory, disk I/O and query telemetry together, and automate alerts and autoscaling of worker pools so growth remains predictable and safe.
