Project Overview and Goals
Imagine you just took ownership of a project where raw logs, product events, and support tickets are piling up in different corners of the company—and someone asked you to turn that chaos into machine-powered insight. We open this journey by naming the destination: reliable ETL to AI pipelines that let product teams ask questions of data, and let models act on those answers. ETL (Extract, Transform, Load) means pulling data from sources, reshaping it, and saving it where it’s useful; AI pipelines are the automated flows that take that prepared data into model training and serving. As data engineers, our job is to make that handoff dependable, observable, and repeatable.
At its heart, our project aims to move from ad-hoc scripts to a production-grade pipeline that serves both analytics and machine learning. We want reproducible data lineage so you can trace a prediction back to the raw event, automated retraining so models don’t go stale, and monitoring that catches upstream breakages instead of downstream surprises. Another goal is cost predictability: build with components that scale without runaway bills. Finally, we want developer ergonomics—developers and analysts must be able to iterate without bottlenecks.
We’re not building for one person; we’re building for three overlapping teams whose needs shape every decision. Data engineers need robust ingestion and schema evolution policies so pipelines don’t break when a product field changes. Machine learning engineers need curated features, reproducible experiments, and a model registry where trained artifacts live with metadata. Product and analytics teams need timely, documented datasets they can trust for dashboards and ad hoc queries. Designing with these stakeholders in mind keeps the project practical and adopted.
We measure progress with concrete KPIs so we don’t chase abstract perfection. How do you know the pipeline is healthy? We’ll track data freshness (how recent the latest record is), end-to-end latency (time from event generation to model prediction), failure rate (percentage of jobs that error), and model metrics like AUC or RMSE on holdout tests. Operational KPIs include costs per million rows processed and mean time to detect/repair a broken job. These metrics help prioritize work: a slow turnaround time might be fixed by optimizing ingestion, whereas poor model accuracy points to data quality.
Every architecture choice is shaped by constraints, and acknowledging them up front saves painful rework. We must balance latency versus cost—real-time inference is attractive but expensive, while batch scoring is cheaper but slower. Compliance and privacy constraints can require encryption and access controls that influence storage format and cloud choices. Legacy systems and vendor lock-in present integration challenges that push us to favor modular, replaceable components.
To keep momentum, we split the effort into phased deliverables that build value early. Phase one is a minimum viable pipeline: resilient ingestion from a few high-value sources, a central curated dataset, and a baseline model deployed with simple monitoring. Phase two expands sources, adds a feature store and experiment tracking, and introduces automated retraining. Phase three hardens observability, cost controls, and governance around lineage and access. Each phase ends with a demo and measurable KPIs to validate the direction.
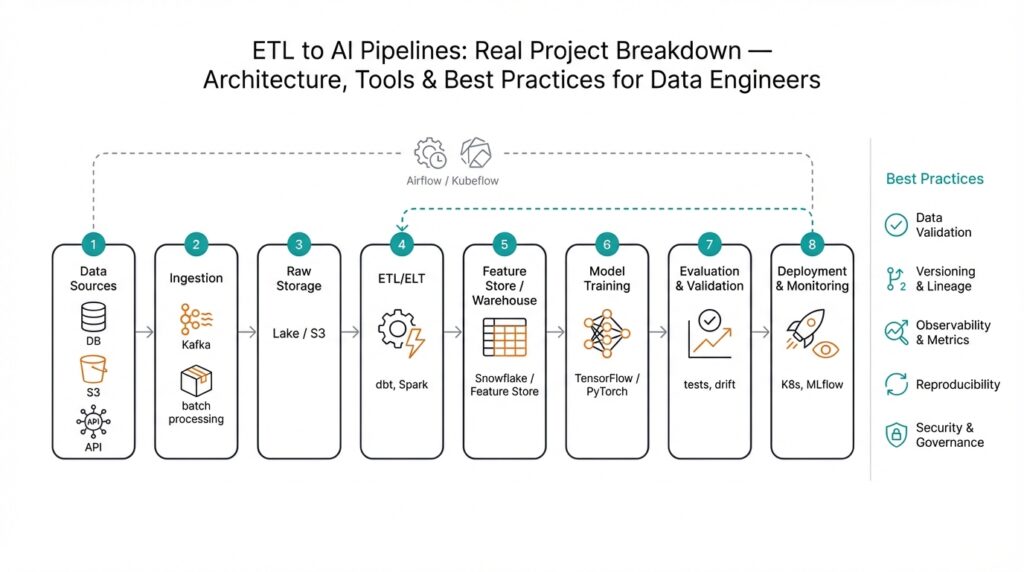
Technically, we’ll stitch together a handful of well-understood components so the whole behaves like a single machine. Ingestion frameworks collect events; a transformation layer (think of it as a dependable kitchen where raw ingredients are washed and chopped) standardizes and enriches data; a central storage layer—whether a data lake or warehouse—holds curated tables; a feature store provides reusable inputs for models; an orchestration tool schedules jobs; and a model registry tracks trained artifacts and versions. We’ll define each tool by the role it plays rather than brand loyalty, which keeps the architecture adaptable.
We also plan for predictable risks and their mitigations early in the roadmap. Data quality issues and schema drift are likely, so we’ll deploy validation tests that reject bad batches and alert teams. Model drift will be detected with continuous evaluation on shadow traffic and scheduled backtests. Cost spikes will be mitigated with quotas and job-size limits. By anticipating these problems, we convert potential showstoppers into manageable tickets.
Building on this foundation, the next step is to sketch the system architecture—mapping components to responsibilities, choosing integration patterns, and deciding where state lives. With clear goals, stakeholders aligned, and measurable KPIs, we’re ready to design an architecture that turns messy inputs into operational intelligence through dependable ETL to AI pipelines.
System Architecture and Components
Building on this foundation, picture the architecture as a city where each neighborhood has a clear job: collecting raw events, cleaning them, storing them, and handing them to models that act. In the first hundred steps you’ll hear the phrase ETL to AI pipelines — that’s our end-to-end flow from extracting raw data, transforming it, and loading it into places models and analysts use — and you’ll also hear “data pipeline” and “orchestration” up front. Orchestration here means the system that schedules and coordinates jobs (think of a traffic controller), and clarity about it up front prevents midnight chaos when jobs collide.
Start by mapping the main neighborhoods so we share the same mental map. Ingestion is where we gather events from apps, logs, and support tickets; ingestion means the first copy of data flowing into the system. The transformation layer is our kitchen where we clean, normalize, and enrich records; transformation means reshaping data into consistent formats and adding derived fields. A central storage layer—either a data lake (cheap, flexible object storage) or a data warehouse (structured, query-optimized tables)—holds curated tables for analytics and downstream ML tasks.
Next we decide how those neighborhoods talk to each other, because patterns matter more than products. On one hand we have batch processing (periodic jobs that process chunks of data), and on the other we have streaming processing (continuous, low-latency handling of events); streaming means events are processed as they arrive. How do you decide between streaming and batch? We weigh latency needs, cost, and complexity: near-real-time inference and alerting push you toward streaming, while regular reporting and retraining often fit batch just fine.
A dedicated feature store and a model registry become the project’s shared utilities rather than optional extras. A feature store is a system that stores, documents, and serves model features (reusable inputs for machine learning) so different teams don’t reimplement the same logic. A model registry is where trained artifacts live with metadata like version, training data snapshot, and evaluation metrics so you can roll forward or back predictably. When we treat these as first-class components, reproducibility and team handoffs stop being wishful thinking and become operational practice.
Orchestration and execution are the plumbing that keeps things running reliably. An orchestration tool (a scheduler and workflow manager) runs tasks, captures logs, retries failures, and enforces dependencies; it should support idempotent runs so replays don’t corrupt state. For compute isolation we use containers (lightweight units packaging code and its environment) and sometimes container orchestration (tools that manage many containers) to scale workers up and down. The orchestration layer also records data lineage—who produced what and when—which is priceless during incident response and audits.
Observability and data quality are the project’s early-warning system and are non-negotiable. Data validation means automatic checks that reject bad batches or raise alerts when schema drift occurs; schema drift is when the shape of incoming data changes unexpectedly. Instrument pipelines with both service metrics (latency, error rates) and data metrics (row counts, null rates, distribution shifts), and expose them to dashboards and alerting so the right team sees the right problem. Continuous evaluation—running models on holdout or shadow traffic—lets you detect model drift before customers notice.
Finally, translate architecture into operational responsibilities so the map guides daily work. Assign owners for ingestion, transformation, feature serving, and model ops; define SLAs for freshness and failure recovery, and bake in access controls and encryption where compliance requires them. Keep cost controls at the orchestration layer (job size limits, quotas) so scale doesn’t surprise you. With these pieces placed and responsibilities clear, we can move from design to phased implementation—where each component becomes a tested, replaceable building block in our ETL to AI pipelines.
Data Sources and Ingestion
Building on this foundation, picture the moment you first open the door to the company’s data attic: product events streaming in from the app, server logs piling up, and support tickets arriving in a separate system. This is where data ingestion begins — the first copy of raw records entering your ETL flow and the lifeline for any reliable data pipeline. We’ll treat ingestion as a set of intentional choices, not a messy grab-bag, because how you collect data shapes every downstream ability: freshness, traceability, and model quality.
The first practical step is to take an inventory of sources and their flavors so you know what you’re dealing with. Sources typically look like event streams from clients (clicks, pageviews), transactional databases, log files from infrastructure, third-party APIs, and human-driven systems like helpdesk tickets; change data capture (CDC) — a technique that streams database changes — is common for keeping tables in sync. Name each source, note its velocity (events per second), and record its authority (who owns the data). This simple catalog becomes our onboarding playbook and helps us prioritize which sources to ingest first.
Next we choose an ingestion pattern, because not all data arrives or is needed the same way. Streaming ingestion means processing events as they happen for low latency; batch ingestion collects chunks on a schedule for cost efficiency. How do you decide between streaming and batch ingestion? We ask: how fresh must the data be, what is the cost budget, and how complex can we tolerate? Often the answer is hybrid: critical user events stream in for near-real-time features while analytics tables are populated with daily batches.
While selecting patterns, we must also agree on delivery guarantees and wire formats so consumers can rely on the data. Delivery guarantees like at-least-once (events may repeat) and exactly-once (each event processed once) sound abstract, but they’re like postal rules — you need to know whether duplicate letters might arrive. For formats, lightweight JSON is great for human-readable events, Avro or Protobuf work well for streaming with schemas, and columnar formats like Parquet are ideal for storing large batches economically. Pairing a schema registry with your message bus prevents nasty surprises when fields change and helps manage schema drift — the gradual reshaping of incoming data that would otherwise break jobs.
On the architecture side, we design collectors, a durable messaging layer, and a raw landing zone that mirrors the flow from source to storage. Collectors are SDKs, agents, or webhook endpoints that batch and forward events; a message bus (a durable queue) decouples producers from consumers and smooths spikes; the landing zone — an object store or raw table — keeps immutable copies for replays. Build idempotent consumers and backpressure handling so retries don’t double-write and surges don’t overwhelm downstream systems; think of idempotency like a safety latch that prevents adding the same ingredient twice.
We never let data quality be an afterthought at ingestion. Early validation rejects malformed batches, lightweight schema checks flag missing fields, and automated masking removes sensitive data before it lands in broadly accessible zones. Instrumenting metrics at the ingestion boundary — row counts, lag, error rates, and schema-change alerts — gives us the early-warning signals we need to protect SLAs and cost budgets. These checks also feed lineage records so you can trace a modeled prediction back to the exact raw event in the landing store.
With sources cataloged, patterns chosen, and validations in place, ingestion hands a dependable feed to the transformation layer — our kitchen where raw ingredients are cleaned and refined. Next we’ll move from collection to transformation, showing how to turn that trustworthy raw copy into curated tables and reusable features for models and analysts.
Transformations and Feature Engineering
Imagine you’ve just pulled the raw landing files into your workspace and the product events look like a messy journal — timestamps in different zones, user IDs missing in places, and a storm of nested JSON fields. Right away you’re facing transformations and feature engineering as the twin tasks that turn that journal into something a model or analyst can actually use. Transformations here means the deliberate reshaping of raw rows into consistent, typed records; feature engineering means creating the inputs — the features — that models will learn from. In this stage of the ETL data pipeline we change ingredients into a reproducible recipe for downstream consumers.
First, we need to make the data speak a common language so everything downstream is predictable. That means canonicalization: enforcing schemas, normalizing timestamps to a single timezone, and casting types (convert a text field into an integer, for example). Schema drift — the gradual or sudden change in the shape of incoming data — is a frequent villain, so we treat schema enforcement not as optional but as a gate: lightweight validation at the landing zone rejects malformed batches, while a schema registry (a system that stores and tracks field definitions) helps coordinate changes with producers. Think of this as tuning the knives and measuring cups before you start cooking.
Once the basic shape is stable, we clean and parse fields the way a chef trims and prepares ingredients. Parsing free-text into structured flags, extracting timestamps into session windows, and handling nulls with principled defaults are everyday moves. We also standardize identifiers and apply deduplication rules so that downstream aggregates aren’t lying to you; idempotency during transformation prevents double-counting when jobs are retried. These steps reduce noise and give feature engineering a reliable canvas to work on.
Now we enrich. Enrichment is where context gets stitched to events: join product events with user profiles, lookup geographical data from IPs, or attach weekly campaign metadata from marketing systems. Adding these joins early makes features more expressive — a purchase event paired with a user’s tenure and last-session recency often predicts behavior far better than raw counts alone. We guard these joins with TTLs (time-to-live) and freshness checks so stale profile data doesn’t poison a feature.
Feature engineering is a creative-but-repeatable craft: a feature is a numerical, categorical, or binary input derived from one or more raw fields that helps a model distinguish patterns. When we create a feature like “30-day active ratio” or “average support response time,” we document the logic, the lookback window, and the expected distribution. This documentation becomes the contract between data engineers and ML engineers and is the reason a feature store matters: the feature store stores computed features, metadata, and serving endpoints so teams reuse consistent definitions instead of reimplementing the same logic in different notebooks.
Operationalizing features forces pragmatic trade-offs between offline accuracy and online latency. Offline features power training and backtests and must be computed on full history; online features must be materialized or computed fast for real-time scoring. We use a dual approach: batch materializations for training, and an online store (often a low-latency key-value layer) for serving live requests. The feature store mediates both worlds, ensuring the same transformation code produces both training values and serving values, which preserves parity and reduces surprising model behavior in production.
How do you know when a feature has stopped behaving? We test and monitor like software. Unit tests validate transformation logic on synthetic examples, statistical tests check that distributions haven’t shifted beyond thresholds, and alerting watches null rates, cardinality spikes, and correlation changes with the target. Continuous evaluation — scoring shadow traffic or monitoring model metrics against fresh holdouts — catches silent regressions and gives actionable signals tied to specific features.
With robust transformations and disciplined feature engineering in place, you get reproducibility: every feature versioned, every transformation tracked in lineage, and every materialization tied to a specific data snapshot. That traceability is what lets a model registry roll models forward or back safely and what lets analysts trust curated datasets. Building this bridge between raw ingestion and model serving is the part of the pipeline that converts data into reliable predictive power — and it sets the stage for automated retraining, observability, and governance that follow.
Model Training and Versioning
Building on this foundation, imagine you’ve just curated a dependable feature set and now the question becomes: how do we turn those ingredients into a reliable, repeatable model and keep every iteration traceable? Model training is the process of teaching an algorithm to predict from those features — think of it like baking a loaf from a trusted recipe where the recipe is your code, the ingredients are your feature snapshots, and the oven settings are your compute environment. Right away we want two things: reproducibility (so you can bake the same loaf again) and traceability (so you can point to exactly which recipe and batch produced a particular result). Those guarantees are what make predictions defensible to product teams and auditors alike.
First, let’s name the assets that must travel together during training so you don’t get surprised later. A training run should bundle the exact dataset snapshot, preprocessing code, feature transformations (from the feature store), hyperparameters, random seeds, and the container image or environment specification that ran the job. Capturing this bundle is essential because without it you can’t reproduce metrics or compare experiments fairly; it’s like trying to recreate a dish without knowing the oven temperature. We rely on an experiment tracking system to log metrics and artifacts during model training so every run becomes a searchable historical record rather than a fleeting notebook note.
Experiments are the laboratory where ideas live and die, so we treat them with rigor rather than hope. How do you keep experiments reproducible and roll back safely? We tag each experiment with a stable data version, link it to the transformation lineage, record evaluation metrics on stable holdouts, and store the resulting binary and metadata in a model registry. A model registry is a central catalog where trained artifacts live with their provenance — think of it as a library card catalog for models that stores who trained it, on which data snapshot, with which metrics, and which code commit produced it. This makes it straightforward to compare runs, promote a candidate to staging, or demote a bad release back to a known-good version.
Versioning deserves special attention because models change for reasons both obvious and subtle. Model versioning is not just assigning increasing numbers; it’s about recording what changed and why — a semantic description of model behavior, training data windows, feature versions, and evaluation deltas. Adopt a clear convention (for example: major.minor.patch with tags for dataset and feature-store versions) and store rich metadata so rollback is a single click rather than a forensic exercise. When a new model underperforms in production, a well-instrumented versioning scheme lets you trace the regression to a particular feature change, hyperparameter tweak, or data-shift event.
Automation ties this all into the rest of the ETL to AI pipelines so retraining becomes predictable instead of ad hoc. Retraining can be triggered on a schedule, on detected data drift, or after a performance drop — but whatever the trigger, the retraining pipeline should reuse the same transformation code, run tests on model parity, and push artifacts to the model registry only when quality gates pass. Canary deployments and shadow traffic let you validate new versions in production safely, and a CI/CD pipeline for models enforces checks (unit tests for transformations, statistical tests for feature drift, and integration tests for serving). This automation reduces human error and shortens time-to-recovery when you need to roll back.
Finally, operational practices turn these ideas into durable habits for teams. Treat the model registry, experiment tracking, and feature store as the canonical sources for any promotion or rollback decision; add access controls and audit logs so governance and compliance needs are met; and cost-tag training runs so you understand trade-offs between faster iteration and compute spend. When model versioning, training artifacts, and retraining triggers live in the same lineage-aware system, you get transparency: every prediction can be traced back through transformations, features, and training snapshots. With that in place, we’re ready to focus on serving, monitoring, and continuous evaluation — the next steps that keep models honest in production.
Deployment, Serving, and Monitoring
Building on this foundation, imagine the moment your trained artifact leaves the lab and needs to become part of the product experience — that handoff is where model deployment (packaging and delivering a model so it can make predictions) meets model serving (the live system that answers prediction requests) and pipeline monitoring (ongoing checks that ensure pipelines and models behave). You’ve already versioned features in the feature store and archived training snapshots in the model registry, so the next step is to package that bundle into a reproducible, deployable unit. Think of packaging like putting a recipe, measured ingredients, and oven settings into a sealed kit that any kitchen (compute environment) can run consistently.
The first practical choice you face is how you’ll package and run the model. Containers (lightweight, self-contained runtime environments that include your code and its dependencies) are the most common choice because they make runs reproducible and isolate environments. Pair containers with an image registry and an orchestration tool (a scheduler that launches, scales, and heals containers) so deployments become repeatable and observable. We recommend including the exact feature-store version, transformation code reference, and inference tests inside the container image so what runs in staging is the same as what runs in production.
How do you choose a deployment pattern? Ask whether predictions must be instant, how many requests per second you expect, and what cost envelope you have. Batch scoring (periodic jobs that add predictions to a table) suits use cases where latency is tolerable and cost matters, while real-time inference (an API that answers requests instantly) is necessary for product surfaces that need immediate responses. Canary deployment (releasing a model to a small portion of traffic first) and shadowing (running a new model on live traffic without affecting decisions) are safety patterns that let you validate behavior before full rollout.
Serving is where engineering trade-offs meet user experience. An online store (a low-latency key-value cache for frequently needed features) helps keep request latency low, while a REST or gRPC endpoint provides the prediction API that clients hit. Design your APIs to support batching (grouping multiple inputs into one request) and asynchronous responses for heavy scoring to reduce tail latency; add caching when repeated queries are common. Instrument every endpoint with latency and error metrics so you can spot regressions quickly instead of discovering them from angry users.
Monitoring is not a single dashboard — it’s a system of signals that tie model health to business outcomes. Track service metrics like latency, error rate, and throughput alongside data metrics such as data freshness (how recent the inputs are), null rates, feature cardinality changes, and prediction-distribution drift (when the statistical distribution of predictions changes). Define SLOs (service-level objectives — agreed targets for availability or latency) and alert thresholds that map to an incident playbook so the right team is paged with context. Include model-quality checks that compare recent predictions to holdout or shadow-ground-truth to detect silent accuracy drops early.
Observability and automation close the loop so you can operate at scale. Centralized logging and distributed tracing help debug inference failures, while model-performance dashboards and automated drift detectors can trigger retraining pipelines when quality crosses a threshold. Automate safe rollbacks by wiring the model registry into your deployment pipeline so a bad release can be swapped for a previous version with minimal toil. With these pieces in place — reproducible packaging, resilient serving, and actionable pipeline monitoring — you create a feedback loop that keeps models honest and gives you a clear bridge into continuous evaluation and incident response for the next phase.