Establish Baseline Metrics and Profiles
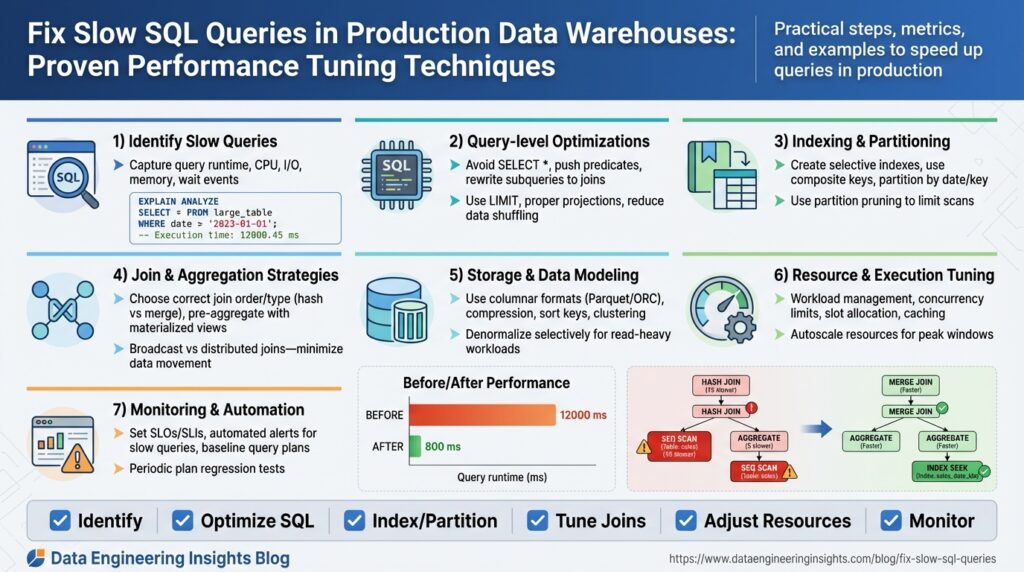
Building on this foundation, the first practical step in taming slow SQL queries in production data warehouses is to establish robust baseline metrics and query profiles that reflect real-world workload. You should capture both system-level telemetry and query-level indicators—things like CPU and I/O utilization, bytes scanned per query, concurrency/slot usage, query duration percentiles, and execution-plan fingerprints—so you can contrast current behavior with expected performance during troubleshooting and performance tuning. Establishing baselines early gives you objective thresholds for regression detection and helps prioritize which queries deserve immediate attention.
Begin by defining what we mean by a baseline and a profile: a baseline is a time-series expectation for a metric (for example, p95 query latency = 3s during peak hours), while a profile is a structural description of a query’s execution characteristics (scan size, join type, estimated vs actual rows, plan shape). We’ll use the term “query profile” to mean the collected plan, runtime stats, and contextual metadata (user, job, parameterization) tied to a fingerprint. Defining these terms up-front removes ambiguity when teams discuss slow SQL queries and aligns engineers around measurable goals.
Collect metrics from multiple layers to create a complete picture. At the infrastructure level capture CPU, memory, disk I/O latency, network throughput, and storage read/write amplification; at the warehouse level capture concurrency/slot usage, buffer cache hit rates, and bytes scanned per query; and at the query level capture execution plans, optimizer estimates, actual row counts, and duration. Use native query logs, EXPLAIN/EXPLAIN ANALYZE output, and any built-in telemetry your data warehouse provides; if needed, emit custom instrumentation in ETL jobs and BI dashboards to tag query families. Sample both peak and off-peak windows to avoid biased baselines that miss worst-case behavior.
Create a minimal, actionable baseline set you can actually monitor and alert on: track p50/p95/p99 query latency for top-100 fingerprints, average bytes scanned per fingerprint, system CPU and I/O saturation, and number of queued or failed queries during peak. For example, you might set an alert when p95 query duration for a critical ETL fingerprint exceeds 2x its historical baseline, or when scanned bytes for ad-hoc analytics jump 3x week-over-week. These threshold examples become your gatekeepers during incident response and guide subsequent performance tuning decisions.
Profile by query shape, not by literal SQL text, to avoid noise from parameter variance and trivial formatting differences. Fingerprint queries by normalized text and plan shape, then bucket them into classes such as small-low-latency lookups, large-scan joins, and periodic ETL jobs. This grouping helps you answer the important operational questions—are regressions caused by a new parameter distribution, a rising data volume, or a change in the execution plan?—and prevents chasing transient outliers that don’t represent systemic slow SQL queries.
How do you know when query performance has truly regressed? Use statistical comparison against baselines (e.g., control charts or rolling windows) and require both a metric breach and confirmation from correlated signals—higher bytes scanned, increased CPU or I/O wait, or a different plan node cost—to reduce false positives. Implement lightweight regression detection: automated daily comparisons of top-N fingerprints, weekly snapshots of execution-plan digests, and retention of historic profiles so you can diff plan trees and optimizer estimates during postmortems.
To act on the baselines, run representative workloads to validate them, store profiles in a searchable dashboard, and schedule periodic re-baselining after schema changes or data growth events. Use the baselines to prioritize tuning steps—index/partition adjustments, rewriting heavy joins, materialized views, or changing resource-class allocations—rather than guessing which fixes matter. In the next section we’ll use these baselines to target the highest-impact queries and walk through step-by-step plan-level tuning techniques that materially reduce latency in production data warehouses.
Analyze Execution Plans and Hotspots
Building on this foundation, the fastest way to reduce tail latency is to read execution plans like forensic evidence: they show where the engine spends CPU, I/O, and network bandwidth, and they point directly at hotspots that drive poor query performance in your data warehouse. Start by treating execution plans as telemetry objects—capture the plan tree, estimated vs actual row counts, operator times, and resource counters for representative runs during peak and off-peak windows. That data lets you separate parameter- or data-distribution issues from legitimate capacity constraints.
A plan node becomes a hotspot when it consumes a disproportionate share of time, scanned bytes, or memory relative to its place in the tree. Look first for large mismatches between optimizer estimates and actual rows: an operator with estimate 1k and actual 10M usually explains long-running nested loops, spill-to-disk, or massive shuffles. Also watch for repeated full scans, large sorts that spill, and broadcast-heavy join patterns; these specific signals indicate different root causes and therefore different fixes. Use EXPLAIN or EXPLAIN ANALYZE (or your warehouse’s equivalent) to capture both the static plan and runtime statistics so you can compare intent against reality.
Operationally, follow a repeatable triage sequence to find the true hotspot quickly. First, identify high-impact fingerprints from your baseline (p95/p99 offenders) and fetch the most recent plan digests and EXPLAIN output for slow executions. Second, correlate plan-level indicators with system telemetry—bytes scanned, CPU saturation, I/O wait, and concurrency at the time of the run—to rule out infra noise. Third, diff the current plan against the historical profile to see if the optimizer changed join type or reorder, if statistics are stale, or if bind values produced an atypical cardinality.
Here’s a minimal illustrative example to make the pattern concrete. Suppose a small lookup suddenly became slow and EXPLAIN ANALYZE shows a nested loop with an unexpected outer row count:
-- simplified EXPLAIN ANALYZE excerpt
Nested Loop  (cost=10..1000 rows=100 width=64) (actual time=0.1..12000.0 rows=500000)
  -> Seq Scan on users  (cost=0..200 rows=5000) (actual rows=500000)
  -> Index Scan on profiles (cost=0.01..0.5 rows=1) (actual rows=1)
In this case the optimizer underestimated rows on the users scan and chose a nested loop; the actual outer cardinality caused the nested loop to execute millions of index probes. The hotspot is the outer scan and the join choice; fixing it requires restoring correct statistics, adding a more selective predicate, or forcing a hash join when memory allows.
Hotspots often hide behind data skew, parameter sniffing, or plan instability. Detect skew by sampling actual row distributions per partition or per bucket and by looking for operators that show a heavy tail in their timing histogram. If one partition consistently consumes 80% of operator time, repartitioning or salting keys can rebalance the workload. If parameter sniffing causes wildly different plans, consider plan-stable constructs (e.g., option(RECOMPILE) carefully), explicit histograms, or runtime plan guides where supported.
How do you triage a plan change in minutes rather than hours? Automate plan capture and diffing, set thresholds for estimate:actual ratio (for example, trigger when ratio > 100x), and keep a short-history store of plan fingerprints and runtime counters. When alerted, reproduce the slow run with captured bind values against a snapshot or a scaled sample, verify statistics freshness and recent DDL, and then iterate: adjust stats, test join rewrites, try a materialized pre-join, or increase resource class for that workload. These concrete steps turn execution plans from opaque blobs into actionable remediation paths.
Taking this concept further, integrate plan-level baselines with your incident playbook so plan regressions become first-class alerts alongside p95 latency and scanned bytes. That linkage lets us prioritize fixes that change plan shape—statistics updates, distribution-aware rewrites, and materialized aggregates—so our next step can focus on targeted plan-level tuning techniques that deliver predictable query performance improvements.
Optimize Indexes, Statistics, and Partitions
Building on this foundation, the fastest wins often come from right-sizing indexes, statistics, and partitions early in the pipeline because they directly control how much data the engine must scan and how accurately the optimizer chooses a plan. If you want measurable improvements in query performance in a production data warehouse, ask yourself: how many bytes does the query scan, are optimizer estimates close to reality, and can partition pruning eliminate whole file ranges? These three levers—indexes, statistics, and partitions—are our primary tools for reducing scanned data, avoiding expensive joins, and stabilizing plan selection.
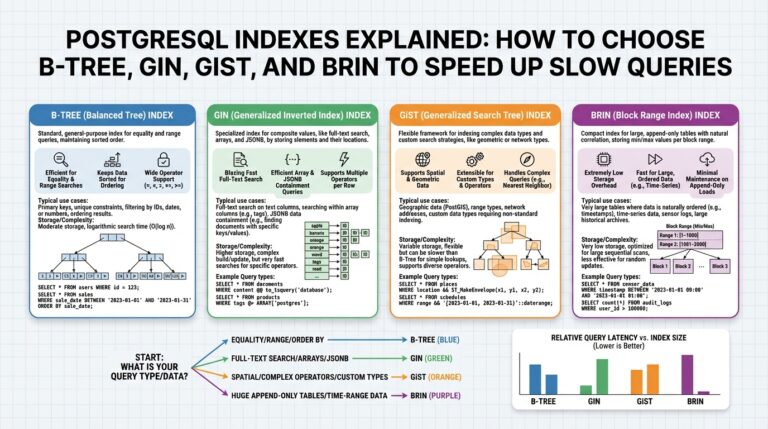
Start with indexes because they change data access paths most visibly. An index is a physical or logical structure that lets the engine find rows without a full table scan; types include B-tree-like ordered indexes, bitmap structures for low-cardinality columns, and covering or composite indexes that satisfy queries entirely. In warehouses that support secondary indexes or clustering, create indexes on selective predicates used in frequent filters or join keys, and prefer covering indexes for narrow, high-frequency lookups. For example, a simple index creation looks like:
CREATE INDEX idx_orders_customer_date ON orders (customer_id, order_date);
Create the index, then run representative queries under your baseline to confirm reduced scanned bytes and lower p95 latency.
Accurate statistics are the glue between schema choices and the optimizer. Statistics summarize column cardinality, histograms, and correlation information so the optimizer can estimate row counts; stale or sparse statistics lead to large estimate:actual gaps and poor join choices. Refresh stats after bulk loads, large deletes, or when cardinality shifts—use your engine’s ANALYZE/UPDATE STATISTICS equivalent and consider higher sampling or histogram buckets for skewed columns. Compare EXPLAIN estimate vs actual row counts before and after updating stats; a drop in estimate:actual ratio usually explains why a nested-loop became a hash join or vice versa.
Partitioning reduces the working set by isolating data into logical ranges or hashes so queries scan only relevant slices. Partition by time ranges for event data or by business key for high-cardinality joins; partition pruning (also called partition elimination) can turn a 100GB scan into a 100MB scan when predicates align with partition keys. Implement a range partition on an ingestion timestamp for daily ETL workloads, for example:
CREATE TABLE events (
  event_id bigint,
  event_time date,
  payload jsonb
) PARTITION BY RANGE (event_time);
Be mindful of partition granularity: too few partitions hurt pruning, too many increase planner overhead and metadata churn. Also plan lifecycle operations—add/drop partitions as part of your ETL orchestration and ensure statistics are collected per new partition.
Treat these levers as interacting knobs rather than independent fixes. Indexes without fresh statistics may be ignored; partitions without matching predicates won’t be pruned; statistics collected at the table level may hide per-partition skew. Where your engine supports clustering or sort keys, use them to colocate data physically, which improves index locality and reduces I/O for range scans. Periodically rebuild fragmented indexes and collect incremental stats on hot partitions to keep the optimizer’s inputs accurate.
When should you change one vs the other? Prioritize adjustments that yield the largest reduction in scanned bytes for high-p95 fingerprints identified in your baseline. Reproduce the slow run, capture EXPLAIN/EXPLAIN ANALYZE, then try a targeted change—add an index, increase histogram resolution, or repartition a hot key—and compare plan shape and bytes scanned. By iterating with controlled experiments on a representative dataset, we can validate that the change reduces tail latency rather than shifting cost elsewhere.
Taking this concept further, integrate index maintenance, statistics collection, and partition lifecycle into your deployment pipeline so changes are automatic and measurable. As we discussed when analyzing execution plans, these structural tuning steps change plan shape deterministically—our next step is to use those plan-level changes to implement targeted rewrites, resource-class adjustments, or materialized pre-aggregations that lock in predictable query performance.
Use Materialized Views and Caching
Building on our baseline and plan-profiling work, materialized views and caching are some of the highest-leverage tactics to reduce scanned bytes and p95/p99 latency in a production data warehouse. If you want predictable query performance, precomputing expensive joins or aggregates with materialized views and layering lightweight caches for hot result sets often yields the largest ROI. How do you choose between a materialized view and an application cache when both can serve the same slow query? We’ll walk through decision rules, implementation patterns, and operational tradeoffs so you can apply the right approach for your SLAs.
Start by treating a materialized view as a precomputed result set that lives inside the warehouse and is managed by the engine; caching refers to storing query results outside the engine (or in a warehouse result cache) for fast reuse. A materialized view is best when you need the optimizer to rewrite queries automatically, when datasets are large, or when many different queries can reuse the same pre-join or aggregation. Caching is superior when results are small, when sub-second response time is required for interactive dashboards, or when you want fine-grained control over invalidation and TTL. Use the baseline metrics you already collected—p95 latency, bytes scanned, and fingerprint frequency—to decide which hotspot merits a persistent materialized precomputation versus a short-lived cache.
Implement materialized views as targeted pre-aggregations or pre-joins aligned to the query shapes you profiled earlier. For example, precompute daily rollups or a frequently-joined dimension-lookup so the heavy shuffle and scan work is done once per refresh window. In many warehouses you can create an MV and enable automatic query rewrite so incoming SQL transparently uses the precomputed data:
CREATE MATERIALIZED VIEW mv_customer_day AS
SELECT customer_id, DATE(order_time) AS day, COUNT(*) AS orders, SUM(total) AS revenue
FROM orders
GROUP BY customer_id, DATE(order_time);
-- schedule FAST/INCREMENTAL refresh or run REFRESH MATERIALIZED VIEW mv_customer_day;
Choose a refresh strategy that matches data churn: on-commit for transactional updates, scheduled incremental refresh for batched ETL, or full refresh for rarely-updated wide tables. When supported, use incremental/fast refresh to avoid recomputing entire partitions; align MV partitions with your base-table partitioning to make refreshes cheap and predictable.
Caching strategies should complement materialized views, not replace them. Use the warehouse result cache for repeated identical queries where the engine provides it, and use an application cache (Redis or similar) for parameterized queries or dashboard tiles that demand millisecond responses. Design cache keys around normalized query fingerprints and parameter buckets, and set TTLs based on your SLA and the measured time-to-staleness for that dataset. For example, transactional leaderboards might use a 30-second TTL with background refresh, while financial reports use materialized daily aggregates with nightly refresh.
Balance consistency and cost by treating staleness as a tunable parameter. Quantify acceptable staleness using metrics from your baselines: how often do results change materially, and what p95 latency reduction do you gain per minute of staleness? Monitor both correctness (by occasional lightweight validation queries that diff MV contents against authoritative sources) and economic cost (storage for MVs, compute for refreshes, memory/network for caches). When staleness causes business risk, tighten refresh frequency; when cost outweighs impact, lengthen TTL or move to coarser-grained pre-aggregations.
Operationally, instrument and automate maintenance. Enable query-rewrite logs and verify that the optimizer uses the materialized view for targeted fingerprints, track MV refresh durations and failures, and surface cache hit/miss rates in your dashboards. Be mindful of storage and refresh compute: large, frequently refreshed MVs can shift cost from query-time to refresh-time, so include those costs in your SLO calculations. Finally, integrate MV and cache lifecycle operations into CI/CD so schema changes and partition rotations don’t silently break rewrites or invalidation logic.
Taking this concept further, use materialized pre-joins to stabilize plan shape and combine them with edge caches for the hottest interactive paths; this hybrid approach often yields the best tradeoff between query performance and operational cost. As we move to plan-level rewrites and resource-class adjustments, we’ll use the same baselining and profiling signals to measure the real-world impact of these precomputation and caching strategies.
Refactor Queries and Reduce Data Scanned
Building on this foundation, the fastest, highest-ROI way to lower tail latency is to refactor queries so they scan far less data. When we refactor queries and reduce data scanned, we attack the dominant cost driver in production data warehouses: bytes scanned. How do you refactor queries to drastically reduce bytes scanned and improve query performance? Start by treating every predicate and projection as an opportunity to shrink the working set and force the optimizer to touch fewer bytes.
The first principle is push computation down and prune early. Predicate pushdown means applying filters as close to the table scan as possible so the engine reads fewer rows from storage; projection pruning means selecting only the columns you need so IO and network serialization shrink. When you push aggregations and filters earlier in the plan—before expensive joins or shuffles—you reduce intermediate volumes and the cost of repartitioning. These are not micro-optimizations: for many analytic queries a small change to predicate placement will convert a 100GB scan into a 100MB scan and shift a p99 from minutes to seconds.
Practical rewrites matter. Replace broad scans and SELECT * with targeted projections, and push filters into derived tables or CTEs where the engine will prune partitions and apply vectorized IO. For example, compare these shapes:
-- high-scan shape
SELECT * FROM events JOIN users ON events.user_id = users.id WHERE events.event_time >= '2025-01-01';

-- refactored shape
WITH recent_events AS (
  SELECT event_id, user_id, event_time, payload
  FROM events
  WHERE event_time >= '2025-01-01'
)
SELECT e.event_id, u.email
FROM recent_events e
JOIN users u ON e.user_id = u.id;
The refactored query front-loads the date predicate and narrows columns so the engine can exploit partition pruning and columnar projection. Beware of engine-specific CTE materialization rules; if your warehouse materializes CTEs by default, convert to an inline subquery or hint the optimizer to avoid unnecessary materialization.
Joins are the second major lever: change join patterns to minimize intermediate expansion. Replace large inner joins that duplicate rows with semi-joins or EXISTS checks when you only need membership, and prefer hash or broadcast strategies for well-partitioned joins instead of nested loops. For example, use EXISTS to filter upstream tables without bringing down entire dimensions:
SELECT o.*
FROM orders o
WHERE EXISTS (
  SELECT 1 FROM fraud_rules fr WHERE fr.customer_id = o.customer_id AND fr.active = true
);
That switch often avoids a costly join that multiplies rows and increases bytes scanned.
Partition-awareness and locality are the third lever. Rewrite predicates to align with partition keys and clustering/sort keys so partition pruning eliminates whole file ranges. If you have event_time partitions, ensure date predicates aren’t wrapped in functions that prevent pruning (avoid DATE(event_time) = … when event_time is already a partition key). Where joins cross partition boundaries, consider partition-wise joins or colocating data to avoid expensive shuffles; repartitioning or salting hot keys can remove single-partition hot spots and reduce skew-driven scans.
Address parameter sniffing and plan instability by using plan-stable constructs where appropriate. If bind-value variability causes plans that scan wildly different volumes, use typed literals, optimize for the common case via query templates, or apply runtime hints to choose a join method that is robust to parameter skew. We should also combine these rewrites with the materialized view and caching strategies discussed earlier: refactoring queries often reduces the refresh cost of MVs and improves cache hit rates because smaller result sets are easier to store and invalidate.
Operationalize changes: measure bytes scanned and query performance before and after each rewrite using representative binds from your baseline, capture EXPLAIN ANALYZE to confirm reduced IO and lower operator times, and require objective improvements to bytes-scanned and p95 latency before deploying. By treating query refactoring as repeatable experimentation—measure, change, validate—we can reliably reduce data scanned across high-p95 fingerprints. Taking these steps prepares us to apply targeted plan-level rewrites and resource-class adjustments that lock in those gains.
Monitor Resources and Enforce Governance
Building on the baselines and plan-profiling we established earlier, treating observability and governance as first-class controls prevents many regressions that turn routine work into slow SQL queries in production. Start by front-loading monitoring so you see resource contention before SLAs break: surface p95/p99 latency, scanned bytes per fingerprint, slot or concurrency usage, and system-level CPU/IO pressure within the same dashboard. When these signals are correlated with plan digests and optimizer-estimate vs actual ratios, you get a rapid root-cause path instead of noisy paging. This upfront visibility is the foundation that lets policy enforcement be surgical rather than punitive.
Instrument across three layers so governance decisions are informed by telemetry: infrastructure (CPU, memory, disk I/O latency, network throughput), warehouse execution (concurrency, slot consumption, buffer/memory usage, cache hit rates), and query-level (bytes scanned, execution plan fingerprint, estimated vs actual rows). Use the baselines you already collected to set dynamic thresholds rather than static limits; for example, trigger an investigation when scanned bytes for a fingerprint exceed its historical p95 by 3x. Align metric retention and sampling to your incident cadence so you can diff runs and attribute regressions to schema changes, data growth, or different bind values.
Good governance is policy plus guardrails. Define resource classes, per-team quotas, and workload queues so heavy analytic ETL jobs don’t evict interactive dashboards. Implement per-user or per-role scanned-bytes caps, soft warnings that inform the analyst, and hard caps that require approval or route the query to a lower-priority queue. How do you make resource limits enforceable without frustrating analysts? Provide lightweight self-service: a dev sandbox with higher temporary limits, an approval workflow for one-off large ad-hoc queries, and transparent feedback (estimated cost, likely impact) before execution so users can optimize proactively.
Alerting should combine SLI/SLO thinking with automated remediation. Define SLIs such as p95 latency and mean bytes scanned for top-N fingerprints and express SLOs that reflect business tolerance for staleness and cost. When an SLO is breached, correlate to plan changes and trigger targeted actions: cancel runaway ad-hoc queries, pause noncritical ETL, or scale an isolated resource pool for an emergency window. Automate these responses conservatively at first—notify owners then inject throttles—so you avoid noisy kill switches that interrupt legitimate business runs.
Enforce policy at execution time using a lightweight policy engine or gateway that evaluates preflight estimates and plan digests. Run a fast cost-estimate or EXPLAIN during admission and apply rules like IF estimated_bytes > team_threshold THEN require_approval ELSE allow_with_logging. Integrate these checks into CI for scheduled SQL changes so dangerous rewrites never reach production unreviewed, and fail the deployment with the same explain output you would surface in an interactive query review.
Tie governance to finance and ownership through tagging and chargeback. Require queries and jobs to include team or cost-center tags, surface per-team scanned bytes and compute consumption, and send monthly reports that map operational impact to owners. When teams see the cost of inefficient joins or stale materialized views, optimization becomes a prioritized engineering task instead of an opaque ops burden. Use these reports to inform capacity planning and to tune resource-class allocations during peak windows.
Taking this concept further, embed governance into the release and incident playbooks so policy, monitoring, and plan baselines are part of every deployment. When we couple live telemetry with pre-execution checks and a clear ownership model, we turn slow SQL queries from recurring firefights into measurable, preventable events. In the next section we’ll apply these controls to make plan-level rewrites and materialized-precomputation decisions safer and more repeatable across teams.
