Define production requirements and metrics
Defining clear production requirements and metrics up front prevents the familiar trap of shipping a model that performs well in the lab but fails under real-world constraints. Start by translating business outcomes into measurable production requirements: what must the system guarantee for users, what costs are acceptable, and what failure modes are critical. Front-load these constraints into design choices so model selection, data pipelines, and deployment patterns reflect the same priorities you will monitor after launch. Treat these requirements as contracts with stakeholders rather than vague aspirations.
Separate functional requirements from non‑functional ones and write them so they map directly to metrics you can instrument. Functional requirements cover task-specific quality — for example, detection precision of 95% or a recall floor for rare-class recognition. Non‑functional requirements cover latency, throughput, availability, and cost per inference; specify them as percentiles and budgets (p95 latency, requests/sec, monthly GPU-hours). This distinction forces you to think about tradeoffs: higher accuracy may justify more compute, but only if the business value offsets increased latency or cost.
Choose metrics that reflect business impact rather than abstract model scores. What causes customer churn: slow responses, high false positives, or inconsistent results across devices? How do you choose a threshold for alerts versus retraining? For instance, a surveillance system where false positives waste operator time will prioritize precision; a medical triage application must prioritize recall and calibrated uncertainty. Tie each metric to a consequence: missed detections cost X, erroneous alerts cost Y, and budget overruns trigger throttling.
Instrument for observability at the feature and inference level rather than relying solely on aggregate model accuracy. Record input metadata, model confidence, feature distributions, and downstream signals such as user feedback or manual labels. Compute distribution-shift signals (for example, PSI — population stability index) and rolling statistics (median, p95) over windows to detect drift early. This per-feature telemetry makes it possible to root-cause regressions and distinguish data issues from model degradation.
Operationalize SLOs and alerting with concrete thresholds and error budgets that match your risk tolerance. Define SLOs like “p95 latency < 200 ms”, “model accuracy > 92% on production-labeled sample”, or “false positive rate < 1% for high-risk classes” as examples you can adjust to your domain. Configure layered alerts: fast, noisy alerts for immediate operational issues (latency spikes) and slower, higher-confidence alerts for model-quality regressions (sustained drop in real-world accuracy). Automate responses where possible: canary rollbacks for performance regressions and throttling or degraded-mode fallbacks when downstream systems are overloaded.
Keep continuous labeling and human-in-the-loop sampling as part of your metric strategy. Periodically sample low-confidence and high-impact inferences for manual review to compute ground-truth metrics in production. Use active learning to prioritize labeling budget on examples that would most improve production metrics, and track label drift separately from model performance to detect annotation-policy mismatches. This practice ensures your production metrics remain meaningful rather than drifting away from actual user impact.
Include resource, cost, and compliance metrics alongside quality metrics to avoid surprises. Track GPU/CPU utilization, cost per 1,000 inferences, cache hit ratios, and pipeline queue lengths so you can correlate cost with performance. For regulated domains, add auditability metrics: percent of inferences with provenance, percentage of requests anonymized, and the time to produce compliance artifacts. These operational metrics feed budgeting and security reviews and often determine whether a system remains viable at scale.
Assign metric ownership and integrate checks into CI/CD and release processes so metrics drive decisions, not dashboards. Designate an owner for each class of metric who can authorize rollbacks and prioritize fixes; include metric thresholds in gating rules for canary promotion. Run regular metric reviews with product and infra teams to re-evaluate which production requirements still matter as usage patterns evolve.
Building on this foundation, instrumented, business-aligned metrics become the control signals that drive retraining, rollout strategies, and architectural changes. In the next section we’ll use these production signals to design safe rollout patterns and automated remediation loops that keep models robust in the wild.
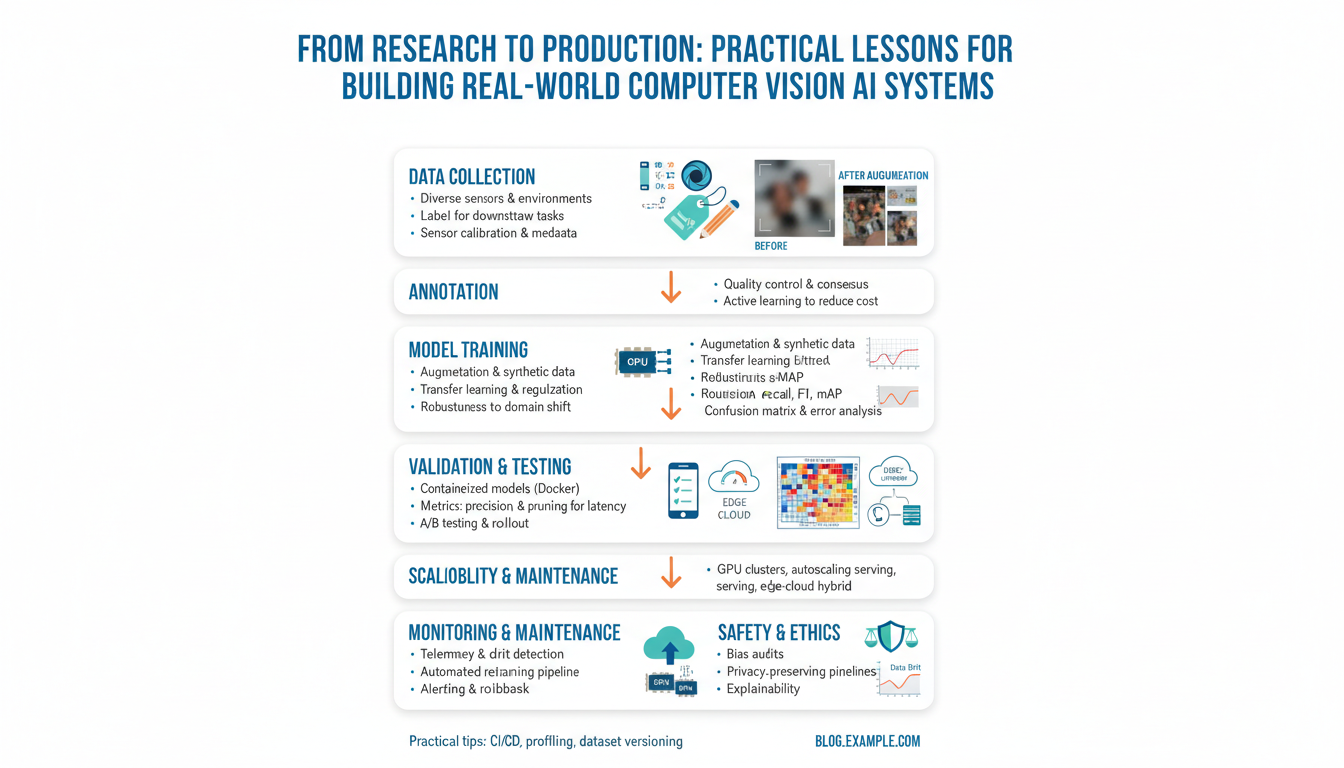
Data collection, curation, and labeling
If your model fails after deployment, the root cause is more often the data pipeline than the architecture. Start by treating data collection, data curation, and labeling as engineering problems with SLAs and ownership rather than one-off research chores. Define what success looks like in production terms: what distributions we must cover, which edge cases are mission critical, and how much annotation budget we can spend per improvement in production metrics. Front-loading those constraints prevents wasting labeling cycles on low-impact examples.
Building on the metric-driven approach we described earlier, design your sampling strategy to optimize for production impact rather than aggregate benchmark scores. Decide upfront which slices you’ll monitor (device types, lighting, geographic regions) and bias your collection toward underrepresented or high-cost failure modes. How do you prioritize examples for human review? Use uncertainty and impact heuristics together: score = uncertainty(pred) * importance(slice), then sample top-K for annotation. This focuses your labeling budget where it will move p95 latency, precision, or recall most effectively.
Labeling quality is the signal that turns raw images into repeatable business value, so invest in a clear annotation schema and an auditable policy. Define labels as structured ontologies—primary class, sub-class, occlusion flags, and confidence tiers—and document ambiguous cases with visual examples. Use overlapping batches for inter-annotator agreement and compute Cohen’s kappa or F1 between annotators to surface systemic ambiguity. When disagreement is high, refine the policy and re-label a small seed set; disagreement often hides label drift, not model noise.
Curation is where you make the dataset predictable and maintainable: deduplicate near-identical frames, remove corrupted inputs, and balance long-tail classes with synthetic or targeted real collection. Track provenance and versions for every datum—where it came from, which augmentation was applied, and which label policy version produced the annotation—so you can reproduce training runs and diagnose regressions. Keep a compact validation shard that mirrors production distributions and a larger, evolving training pool for experimentation and continuous learning.
Operationalize human-in-the-loop workflows to keep labeling costs proportional to benefit. Route only high-impact or low-confidence examples to annotators, automate straightforward tasks (e.g., easy bounding boxes suggested by pre-trained detectors), and enforce a multi-stage QA: primary label, independent review, and consensus or arbitration. Measure throughput and cost per effective label; treat labeling as a feature of the product with KPIs. When possible, batch similar tasks to reduce context switching for annotators and improve consistency across labels.
Integrate curation and labeling with your observability stack so production telemetry triggers data work automatically. Instrument inferences by storing input metadata, prediction confidence, and downstream feedback; run rollups that flag slice drift or a rising population stability index for particular features. When a slice crosses its drift threshold, automatically funnel a sampling of recent inputs into the labeling queue and create a retraining experiment tied to the production metric you care about. This closes the loop between monitoring, labeling, and model updates.
Ultimately, treat dataset engineering as continuous product work: assign owners, schedule regular label audits, and include dataset gates in CI/CD. We want datasets that evolve in lockstep with the service-level objectives we’ve set: reproducible, auditable, and cost-effective to grow. In the next section we’ll use these dataset control signals to design rollout and remediation patterns that keep models reliable under real-world constraints.
Synthetic data and augmentation strategies
Synthetic data and targeted data augmentation are powerful levers when real-world collection is expensive, scarce, or slow to cover edge cases. If your production metrics demand coverage for rare slices or you need rapid iteration on new device types, synthetic data lets you generate labeled examples at scale while controlling distributional parameters. Data augmentation strategies extend this by expanding variability without additional annotation cost, which helps reduce brittle decision boundaries and improve the model’s robustness to input shift. Front-load these techniques into dataset engineering so they contribute to measurable production objectives rather than becoming an afterthought.
When should you prefer synthetic data over more real collection, and when should you lean on augmentation? Choose synthetic data when the failure mode is structural — for example, rare occlusion patterns, unusual camera geometries, or lawful privacy constraints that prevent collecting real images — because simulation can produce precise labels for those scenarios. Use data augmentation when the gap is variability within an already-valid distribution, such as lighting, compression artifacts, or small viewpoint changes; augmentations are lightweight, cheap, and integrate directly into training pipelines. Combining both approaches often yields the best ROI: synthetic examples cover structural gaps while augmentation adds per-sample resilience.
There are three practical generation families to consider: physically based simulation, procedural/content synthesis, and learned synthesis (GANs or diffusion models). Physically based simulation gives you exact control over camera intrinsics, lighting, and occluder placement — useful for robotics and autonomous vehicles — while procedural synthesis (e.g., programmatically composing scenes or textures) is fast for large-scale datasets like retail shelf layouts. Learned synthesis can produce photorealistic variations but risks introducing artefacts that hurt generalization, so we use it selectively for style transfer or fine-grained texture variation. Domain randomization — intentionally over-randomizing appearance — is often effective because it forces the model to learn invariants rather than overfit to narrow visual cues.
Concrete augmentation strategies complement generation: photometric augmentations (color jitter, contrast, compression), geometric transforms (affine, perspective, synthetic camera motion), object-level operations (copy-paste, CutMix), and sensor-noise emulation (motion blur, rolling-shutter, lens flare). For instance, when building a warehouse pick-and-place detector, copy-paste augmentation combined with depth-aware compositing reduced false negatives on occluded items during tests. Implement augmentations as composable, deterministic transforms in your data loader so you can reproduce experiments and ablate the effect of individual strategies on validation slices.
Integrate synthetic and augmented datasets into your curation and labeling workflows with provenance and gating. Track which samples are synthetic, which augmentations were applied, and which label-policy produced the annotation so you can trace regressions back to a source distribution. Use the same production-like validation shard we discussed earlier as the arbiter: never use purely synthetic validation to promote models to production. Instead, reserve a small, representative real holdout for final checks and compute slice-level metrics (precision/recall per device, p95 latency, calibration) to quantify impact.
Avoid common pitfalls: overfitting to synthetic textures, leaking synthetic-specific cues (such as uniform backgrounds), and underestimating label noise introduced by automated pipelines. Mitigation strategies include fine-tuning on a small curated real set, adversarial domain adaptation, and explicitly modeling annotation noise during training. How do you measure success? Run controlled experiments where only one variable changes, track the five most load-bearing production metrics, and use stratified lift on the most critical slices rather than overall accuracy; synthetic data that improves global F1 but reduces p95 recall on a high-risk slice is not acceptable.
Building on our earlier emphasis on production-aligned metrics and continuous labeling, treat synthetic generation and augmentation as part of the dataset lifecycle: version generators, schedule synthetic-sampling based on observed drift, and include synthetic provenance in CI gates. When a drift alert fires for an underrepresented slice, automatically spawn targeted synthetic scenarios and push a canary retrain to validate impact on production metrics before full rollout. This keeps your training data a controllable, auditable instrument for maintaining model reliability in the wild.
Model validation and robustness testing
Building on the production-focused instrumentation and dataset controls we described earlier, the first practical step is to treat model validation as an engineering pipeline with repeatable gates, not an ad-hoc set of benchmark runs. Front-load your validation harness with stratified, production-like holdouts that reflect device types, geographic slices, and edge-case scenarios so your offline checks exercise the same distributional constraints you will monitor in prod. How do you verify a vision model will hold up on messy real-world inputs? Define slice-level acceptance criteria tied to production metrics and run them automatically on every candidate model.
Start validation with deterministic, slice-aware reproducibility: frozen preprocessing, fixed RNG seeds for augmentation ablation, and a compact validation shard that mirrors live traffic. The topic here is measurable guarantees—compute per-slice precision, recall, calibration (expected calibration error, ECE), and p95 latency under realistic batching. Use temperature scaling or isotonic regression to calibrate probabilistic outputs and track calibration drift as a first-class metric; poorly calibrated confidence is often the earliest sign that a model will misroute high-impact inferences in production.
Robustness testing goes beyond average-case metrics and simulates the perturbations your cameras and pipelines will produce. Run systematic corruption suites (photometric noise, compression artifacts, motion blur, lens flare) and geometric stress tests (perspective warp, occlusion masks) to quantify sensitivity. Include adversarial-style probes like FGSM/PGD or randomized patch attacks when worst-case integrity matters, but treat these as targeted stress tests rather than replacement for distributional testing. For many systems, a combination of synthetic scenarios (to cover structural gaps) and real corrupted samples (to capture sensor nuance) reveals brittle failure modes that aggregate metrics hide.
Validate behavior under deployment patterns with shadowing, canaries, and champion–challenger experiments so online robustness testing becomes part of release automation. Run a candidate model in shadow mode alongside the live model to collect differences without affecting users, and promote it to a canary with limited traffic slices once it clears automated slice-SLOs. Instrument rollback triggers tied to business-aligned production metrics—sustained p95 latency regressions, slice recall drops, or rising false positive cost—and automate canary rollbacks to minimize exposure.
Don’t forget non-functional stress tests: throughput, cold-start latency, memory fragmentation, and GPU/CPU tail behavior often cause system-level failures even when accuracy looks good. Build unit tests for preprocessors (invalid images, unexpected channels, extreme aspect ratios), fuzz your inference path with malformed metadata, and measure resource utilization under synthetic peak loads. These operational tests protect your model from emergent failure modes that only appear at scale and ensure that robustness testing includes both model quality and system resilience.
Human-in-the-loop validation closes the loop between offline tests and real-world error repair. Routinely sample high-uncertainty and high-impact inferences for manual review, use active learning to prioritize labeling where Validation-Impact Score = uncertainty * business importance, and maintain a curated evaluation set that evolves with the product. Combine uncertainty estimation techniques—deep ensembles, Monte Carlo dropout, or bootstrapped heads—with routing rules that send low-confidence or out-of-distribution inputs to fallback models or human reviewers. This strategy reduces costly false positives and provides labeled feedback to retrain on real failure modes.
Taken together, these practices make validation and robustness testing actionable: reproducible offline gates, targeted corruption and adversarial probes, canary-driven online checks, operational stress tests, and human-in-the-loop sampling all feed the same production metrics and dataset pipelines we described earlier. By integrating these tests into CI/CD and treating their thresholds as release gates, we ensure that model quality and system reliability evolve together; next, we’ll use these signals to design rollout policies and automated remediation loops that keep models safe in the wild.
Deployment, serving, and CI/CD pipelines
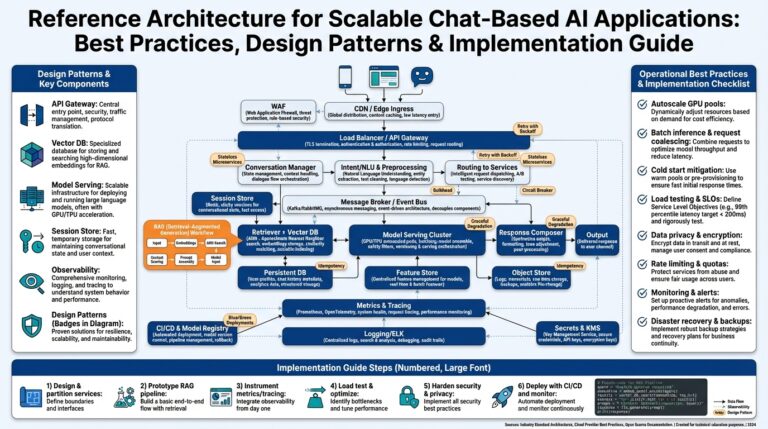
When a vision model leaves the lab, deployment and serving infrastructure determine whether it actually delivers value in production. How do you stitch together container orchestration, hardware-aware scheduling, and model-serving runtimes so the system meets p95 latency and cost budgets we defined earlier? Building on our metric-first approach, start by treating deployment as an engineering pipeline: reproducible artifacts, signed model artifacts, and immutable containers that carry provenance metadata so you can trace any inference back to the training run and label version.
Choose an orchestration strategy that reflects your latency and throughput constraints rather than technology fashion. If you need sub-100ms single-request inference, colocate lightweight model servers on GPU nodes with node-affinity and use explicit CPU/GPU requests to avoid noisy-neighbor interference; when throughput matters more than latency, rely on batched workers and adaptive autoscaling. Orchestration tools and container management must expose resource controls, priority classes, and pod disruption budgets so you can run canaries and rollbacks without starving production traffic—these are deployment-level controls that directly protect SLOs.
Select a serving stack that supports the optimizations your model requires and makes those optimizations reproducible. Use an inference runtime that accepts standardized artifacts (ONNX, TorchScript, TensorFlow SavedModel) to decouple export from serving, and bake quantization, operator fusion, and dynamic batching into your CI builds so you test the exact binary you’ll run in production. For GPU-heavy workloads, validate TensorRT or XLA pipelines in CI with representative input shapes and measure tail latency; for mobile or edge, include hardware-specific builds and size budgets so serving meets device constraints.
Design CI/CD pipelines that treat models like software: unit-test preprocessing, integration-test the full inference path, and gate promotions on slice-level production metrics. Automate model registration with immutable identifiers, store artifacts in a registry, and sign them so promotion to staging and production requires policy checks rather than manual file moves. Implement gated releases: shadow the candidate model for a period to collect shadow metrics, then route a small canary slice and compare production metrics to the champion. If any gate—latency, per-slice recall, or calibration drift—fails, the pipeline should auto-roll back and open an incident with attached provenance.
Integrate observability and data-driven gates directly into your CI/CD workflow so deployments close the loop with dataset engineering. Emit per-inference telemetry (input hashes, feature summaries, confidence, downstream outcomes) into your monitoring system and wire alerts that can block promotion when PSI or calibration crosses thresholds. Use these signals to trigger automated data collection and human-in-the-loop labeling jobs when drift appears; a retrain pipeline should be a first-class CI job that consumes labeled production samples, runs reproducible training, and produces a new signed artifact subject to the same promotion gates.
Operational resilience comes from combining safe rollout patterns with deterministic automation and clear ownership. Codify canary window lengths, rollback triggers, error budgets, and escalation steps in the pipeline so teams can act predictably when incidents occur. As we move into rollout policies and automated remediation, keep in mind that the best serving and CI/CD practices are those that make model behavior inspectable, revertible, and directly tied to the production metrics you and your stakeholders care about.
Monitoring, drift detection, and retraining
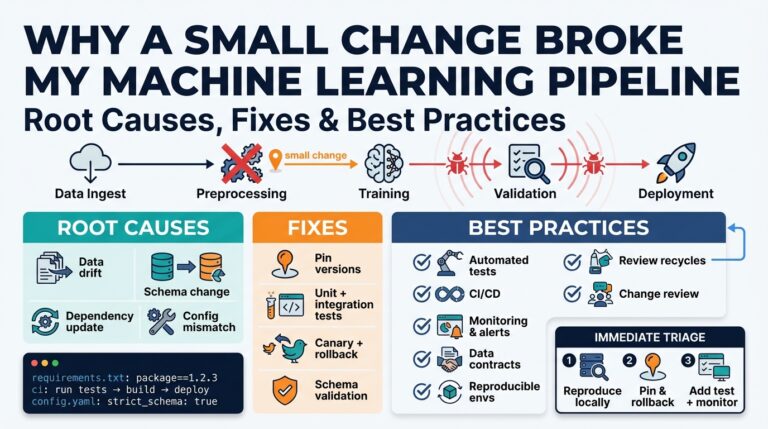
Building on this foundation of production metrics and dataset engineering, robust monitoring, drift detection, and retraining become the operational control loop that keeps models reliable in the wild. We start by treating monitoring as continuous hypothesis testing: are the input distributions and model outputs today statistically consistent with the production baseline? How do you decide when to retrain rather than tune thresholds or collect labels? Framing monitoring, drift detection, and retraining as a single feedback system makes those decisions measurable rather than instinctive.
Drift presents in two common flavors: covariate (input) drift and concept (label) drift, and each requires different signals. For covariate drift, compute feature-wise statistics (mean, variance), distributional distances such as PSI (population stability index), KS or Wasserstein distances, and embedding-space shifts using cosine or Mahalanobis distance; for label or concept drift, compare surrogate labels or downstream outcomes (user corrections, conversions) against expected rates. Implement rolling-window comparisons (for example, a 24-hour versus 14-day window) and operator-friendly visualizations; a short pseudocode pattern looks like: recent = window(data, last=24h); baseline = window(data, last=14d); drift_score = psi(baseline.feature, recent.feature); if drift_score > threshold: flag(). These signals give you precise, auditable triggers for further investigation.
Deciding thresholds and alerting policies requires tying statistical alarms to business SLOs and error budgets rather than fixed p-values. Use layered alerts: low-confidence, high-frequency notices for exploratory ops and high-confidence, low-frequency alerts that will kick off retraining or mitigation. For example, treat PSI > 0.2 on a mission-critical slice as a high-priority alarm only if accompanied by a sustained drop in slice recall or an increase in operator intervention cost; otherwise, route it into an investigation queue. This reduces noisy retrains and aligns retraining cadence with impact on p95 latency, precision, or cost-per-inference.
When an alert fires, triage through correlated telemetry instead of guessing causes. Cross-reference device metadata, camera firmware versions, preprocessing logs, and augmentation provenance to identify upstream changes; visualize sample images, saliency maps, and nearest-neighbor retrievals from the embedding store to surface systematic shifts. A typical root cause might be a camera driver update that subtly shifts color balance, reducing detection recall on a particular SKU; the fix may be a short-term threshold adjustment, a targeted labeling campaign for that device, or a quick fine-tune using collected samples. Correlating feature drift with label feedback gets you from symptom to remediation faster.
Retraining strategies should be pragmatic and versioned: choose between full retrains, warm-start fine-tuning, incremental learning, or replay-buffer approaches based on the magnitude and type of drift. For label-quality regressions or large structural changes, run a full retrain with a curated, versioned dataset and preserve a held-out production-like validation shard; for minor cosmetic shifts, warm-start fine-tuning with a small, well-labeled batch is often faster and less risky. Automate the trigger logic: event-driven retrain when (drift_score > T and slice_metric_drop > M) spawns a reproducible training job that produces a signed artifact, followed by shadow evaluation and canary promotion if slice SLOs pass.
Finally, automate safety checks and guardrails around any retraining loop. Integrate retrain jobs into CI/CD: require slice-SLO gates, calibration checks, and replay-based tests to detect catastrophic forgetting. Use canary rollouts, shadow testing, and staged traffic ramp-ups so you can measure real-world gains before full promotion. By making monitoring, drift detection, and retraining auditable, versioned, and tied to business impact, we create a repeatable operational pattern that feeds back into dataset engineering and deployment — the next step is codifying rollout policies and automated remediation loops that execute these remediations at scale.