Recognize Messy Metrics Symptoms
Messy metrics are rarely obvious until they cost you time, credibility, and budget—and by then remediation is expensive. In the first 24–72 hours after a deploy or incident you should be able to tell whether telemetry reflects reality or noise; if you can’t, that’s the first sign of trouble. How do you know when metrics are misleading versus showing real regressions? If dashboards disagree, alerts scream during normal traffic, or finance reports unexpected cost spikes, you’re probably facing messy metrics that are eroding trust in your analytics stack.
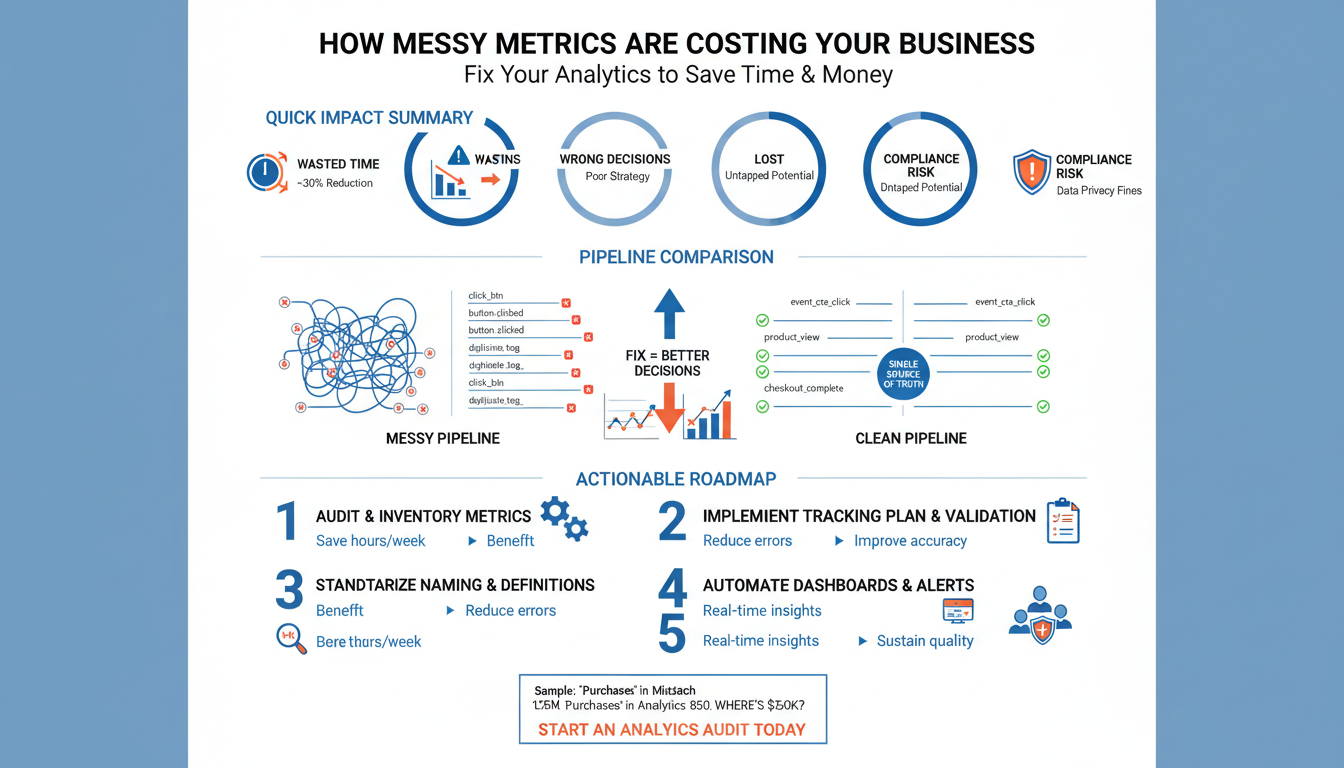
A common early symptom is inconsistent definitions across dashboards and teams. You will notice different counts for the same KPI (for example, DAU or purchase conversions) when product, data, and growth use different event names, time windows, or deduplication rules; the topic sentence here is simple: inconsistent definitions break downstream decisions. For instance, one team might calculate DAU as COUNT(DISTINCT user_id) WHERE event = 'session_start', while another uses WHERE event IN ('open','resume'), producing wildly different values. When leadership asks for a single source of truth and gets three conflicting charts, the cost is wasted analysis and delayed action.
Missing or partial instrumentation creates invisible gaps that bias metrics and force guesswork. If you rely on sampled telemetry or batch-exported events, spikes and short-lived regressions can be erased; conversely, duplicated events inflate rates. You can detect this by comparing raw event throughput to aggregated metrics—if COUNT(*) FROM raw_events does not map to sum(metric_count) within expected tolerance, instrumentation or pipeline sampling is the culprit. These gaps cause wrong capacity planning, inaccurate billing, and missed SLAs because teams operate on incomplete data.
High cardinality and uncontrolled tagging are another telltale symptom that inflates storage costs and slows queries. The problem starts when engineers tag metrics with high-variance identifiers (for example, user_id, session_id, or full URLs) instead of stable dimensions (like region, service, or plan). This pattern produces metric explosion: queries become expensive, query timeouts increase, and cost-per-ingest spikes. We recommend watching for sudden growth in unique label counts and tracing which metric emitted the labels; a single mis-tagged histogram or counter can multiply your billing and push your observability backend to its limits.
Stale dashboards, alert fatigue, and fuzzy ownership destroy confidence faster than any technical bug. When alerts fire hourly for known benign conditions or dashboards are never reviewed, teams start ignoring telemetry; the actionable signal gets buried in noise. For example, an alert defined as error_rate > 0.01 for 5m without context will trigger during controlled rollouts, skewing incident response. Assigning metric owners, documenting definitions, and attaching runbooks to alerts converts noisy telemetry into operational workflows and stops costly wake-up calls for false positives.
Building on this foundation, your immediate triage should be detection, definition, and containment: detect discrepancies with quick SQL/PromQL sanity checks, codify canonical KPI definitions as tests, and contain cardinality by removing high-variance labels. We can run an inventory to map which metrics drive billing and which drive action, then prioritize fixes that reduce rework and wasted engineering hours. In the next section we’ll take those symptoms and translate them into a concrete remediation checklist so you can stop losing time and money to messy metrics.
Quantify Business Impact Quickly
Building on this foundation, the fastest way to stop losing time and money is to turn raw telemetry into a dollar-linked story you can act on within a day. Start by declaring one canonical KPI for the incident or release—one number everyone agrees represents value change (for example, Net Revenue per Day, Checkout Conversion Rate, or Active Paying Users). When messy metrics compete, having that single agreed-upon KPI forces teams to either align definitions or expose instrumentation bugs quickly. Use the KPI as your common language across product, finance, and SRE so you can translate technical regressions into business impact in minutes rather than days.
Next, create a measurement recipe that maps events to monetary outcomes and operational costs. Define the event-to-value pipeline: which raw events (orders, refunds, API calls) map to revenue or cost, what deduplication rules apply, and the time-window semantics for aggregation. For example, compute conversion lift as delta = (conv_rate_post – conv_rate_pre) and then multiply by average order value to get incremental revenue; for costs, translate added ingest or compute time into dollars using your billing rate. These practical mappings make analytics actionable and let you prioritize fixes based on ROI rather than curiosity.
Make rapid sanity checks repeatable and scriptable so you can quantify impact without manual firefighting. First, take a short baseline window (T-7d to T-1d) and a test window (T to T+X) and calculate percent change with confidence bounds. Run a quick SQL snippet like SELECT date, COUNT(DISTINCT user_id) AS dau FROM canonical_events WHERE event IN (‘session_start’) GROUP BY date to compare trends; or a PromQL-style check for service-level regressions. Automate these checks into a single dashboard and a one-click report so that when an alert fires we can immediately answer, “How much revenue or cost moved, and why?”
Attribution matters: separate instrumentation noise from real customer impact by slicing the effect across dimensions that should be stable. Compare regions, plans, and client app versions to see if the delta is production-wide or isolated to a tag that was recently changed. If a particular client version shows a 30% drop in conversions while others are flat, the incident is product-side; if all versions drop simultaneously, investigate upstream services or billing. Translate cardinality and tagging changes into cost implications using a simple formula—extra_cost = (new_ingest_rate – baseline_rate) * cost_per_event—which gives finance something concrete to act on and ties messy metrics to a measurable monthly run rate.
How do you know the change is real versus instrumentation noise? Use canaries, dual pipelines, and quick A/B controls. Deploy a shadow pipeline that writes raw events to immutable storage while your production pipeline continues processing; then run parallel aggregations and compare counts and unique-label growth. Implement small canary splits (1–5%) and guardrails so you can observe real user behavior before rolling wide. Pair these techniques with metric ownership and runbooks so the person responsible for the KPI can both authorize rollbacks and sign off on the quantified impact.
Finally, close the measurement loop by making the first remediation decision a business one: show the incremental revenue or cost reduction from a proposed fix and prioritize accordingly. Run a 24–72 hour audit that codifies canonical KPI definitions, verifies raw_event → metric mappings, and produces a one-page ROI estimate for top fixes; this converts messy metrics into an investment decision instead of a guessing game. When we can answer “what changed, who it affected, and how much it cost” within hours, cleanup becomes prioritizable work rather than perpetual firefighting—next, we’ll turn these rapid measurements into a prioritized remediation checklist you can act on immediately.
Audit Your Tracking Setup
Building on this foundation, the fastest way to stop wasting time and money is a focused audit of your tracking setup — because messy metrics usually start with instrumentation that no one can confidently explain. When dashboards disagree or alerts trigger during normal traffic, you need a repeatable way to verify that events, labels, and aggregation windows map to reality. How do you quickly tell which events are honest signals and which are noise? We treat the audit as a short, surgical exercise: catalog, validate, and protect the metrics that actually drive decisions in your analytics and observability stack.
Start the audit by cataloging every event, metric, and tag that touches your core KPIs. Create an event inventory that lists source, schema, required fields, deduplication rules, sampling rate, and the downstream metrics that depend on it; include examples such as event = 'purchase' with order_id as the dedupe key and event = 'session_start' for DAU. For each entry, capture aggregation semantics — whether a metric is COUNT, SUM(amount), or COUNT(DISTINCT user_id) — and the canonical time window (UTC midnight, rolling 24h, etc.). This inventory becomes the single source of truth that resolves inconsistent definitions across product, data, and finance teams.
Validate the inventory with concrete reconciliation tests so you can prove parity between raw and derived data. Run a small set of reproducible SQL or PromQL checks that map raw event counts to aggregated metrics, for example: SELECT date, COUNT(DISTINCT user_id) AS dau FROM raw_events WHERE event IN ('session_start') GROUP BY date and assert tolerances (e.g., ±1–3% for sampling-aware pipelines). Where differences exceed tolerance, trace the pipeline: check whether sampling, ETL transforms, or label scrubbing removed rows, and flag failing transforms as urgent. We recommend committing these tests to CI so any change that shifts counts fails the PR and forces remediation before deploy.
Contain cardinality and tagging problems during the audit rather than after bills spike. Identify labels with exploding cardinality by querying unique-label growth over time and stop the biggest offenders (full URLs, user_id, or session_id) from becoming metric labels. Replace high-variance labels with stable dimensions like region, plan, or service_name, and provide examples in the inventory: instead of label=url, use label=route truncated to a stable pattern. This small change often reduces query latency and storage costs dramatically and prevents a single mis-tagged metric from multiplying your billing.
Enforce ownership, documentation, and runbooks for every metric that matters. Assign metric owners who are responsible for schema changes, alert tuning, and post-deploy sanity checks; attach a short runbook to high-impact metrics that explains how to interpret spikes, when to silence alerts, and rollback criteria. Pair owners with automated alerts that include the reconciliation test result and a quick ROI estimate (delta revenue or cost impact) so the on-call person can make a business-informed decision rather than guessing. This governance step converts telemetry from noisy signals into accountable operational assets.
Finally, translate the audit findings into prioritized fixes so you reduce toil fast and sustainably. Rank problems by business and technical impact: missing instrumentation for revenue events, duplicated events inflating conversion, and high-cardinality labels that drive cost should be top of the list. We then run targeted remediations — fix schema, patch sampling, adjust labels, add CI tests — in 24–72 hour sprints and measure the ROI in reduced alert noise and lower ingest costs. Taking this disciplined approach to your tracking setup restores trust in analytics and gives you a clean handoff to the remediation checklist that follows.
Clean and Standardize Event Naming
When your dashboards disagree and downstream teams argue over which number is “right,” the root cause is often inconsistent event naming that breaks analytics and inflates toil. Clean event naming is the fast lever that buys you reliable aggregation, cheaper queries, and less time spent reconciling counts. In the first 24–72 hours after a release you should be able to map a KPI back to a small set of canonical events; if you can’t, your naming scheme is probably the blocker. We focus on naming because it is low-effort, high-impact: you can standardize strings quickly and immediately reduce noise in both instrumentation and business reporting.
Start with clear principles that survive churn: use verbs for actions and nouns for objects, prefer a single deterministic separator, and namespace by domain to reduce collisions. How do you choose a naming scheme that survives product changes? Pick a convention like domain.action.status (for example, checkout.purchase.completed) or object.verb (for example, user.session.start) and document it in an event catalog. Keep names immutable where possible—mutating an event name is what creates three different DAU counts—so treat names like API contracts and follow semantic versioning practices when a rename is unavoidable.
Apply concrete patterns so your teams can adopt the convention immediately. Use lowercase dot-separated names (analytics: event naming), and include status or outcome as a suffix rather than overloading the action name. For example, emit user.session.start, user.session.end, checkout.purchase.initiated, and checkout.purchase.completed. Include a stable set of schema fields such as event_name, event_version, timestamp, user_id (only as a payload field, not a metric label), and dedupe_key (order_id or transaction_id). A compact event JSON might look like {“event_name”:”checkout.purchase.completed”,”event_version”:1,”timestamp”:”2025-12-28T14:00:00Z”,”order_id”:”abc-123”,”amount_cents”:4999} — consistent fields make downstream aggregation and deduplication deterministic.
Governance and automation turn guidelines into durable practice: publish a machine-readable event catalog, enforce schemas with a registry, and add linting to CI so misnamed events fail before they reach staging. We recommend a schema registry that validates required fields and types at ingest, plus a pre-commit hook or server-side check that flags nonconforming event_name patterns. Instrumentation libraries should centralize emitters so developers call a single function like emitEvent(‘user.session.start’, payload) which maps to the canonical string—this reduces accidental typos, prevents high-cardinality labels, and gives metric owners a single place to update when semantics change.
Plan for change with explicit deprecation and aliasing rather than blind renames. When you must change an event name, publish a deprecation window, run a dual-write for the old and new names during the transition, and add reconciliation checks to your CI that assert parity between both streams. We recommend keeping the old name writable for a defined window (for example, 90 days) and running nightly parity jobs that compare counts and label distributions; once parity is proven and consumers migrate, mark the old name deprecated and then remove it. This staged approach prevents sudden KPI drift, simplifies rollbacks, and keeps finance and product teams aligned.
Standardizing event names reduces query complexity, trims storage and compute costs, and restores trust in instrumentation—benefits you measure in fewer incident war rooms and faster business decisions. Building on the audit and reconciliation work we discussed earlier, this naming discipline plugs directly into your remediation checklist: catalog current events, apply automated validation, and run a short migration sprint for the highest-impact names. Next we’ll convert these agreed names into CI tests and alerting rules so the canonical KPI definitions you rely on stay correct after every deploy.
Define Actionable KPIs Only
If your dashboards are full of numbers but nobody can tell what to do next, you have too many metrics and not enough actionable KPIs. Actionable KPIs are the small set of measurements that directly map to a decision you can make within a deploy or incident window—things you can act on, own, and measure the effect of. Front-load these canonical KPI choices in your analytics so every alert, dashboard, and postmortem points to business meaning rather than curiosity. When we treat every metric as sacred, we waste engineering time and erode trust in telemetry; focusing on fewer, actionable KPIs reverses that trend.
An actionable KPI must be outcome-oriented, ownerable, and precisely defined. By outcome-oriented we mean the metric maps to a concrete business outcome (revenue, retention, cost, or SLA) rather than vanity counts; by ownerable we mean one person or team is accountable for the KPI and its schema. Define each canonical KPI with exact event mappings, aggregation semantics, deduplication keys, and time-window rules so there is no room for interpretation. For example, document whether a conversion uses COUNT(DISTINCT user_id) or COUNT(DISTINCT order_id), which window to use, and the acceptable tolerance for sampling.
Choose KPIs by asking what decision they will trigger and how quickly you need the answer. Start from workflows: if a deploy can be rolled back within 30 minutes, your KPI must surface meaningful change within that window; if billing reconciliations happen monthly, a slower aggregate KPI is acceptable. A concrete example: compute checkout conversion as “completed_orders / checkout_initiated” over a rolling 1-hour window; in SQL that might look like SELECT SUM(CASE WHEN event=’checkout.completed’ THEN 1 ELSE 0 END)::float / NULLIF(SUM(CASE WHEN event=’checkout.initiated’ THEN 1 ELSE 0 END),0) AS conv_rate FROM canonical_events WHERE timestamp >= now() – INTERVAL ‘1 hour’. This gives you a timely, actionable number to trigger a rollback, mitigation, or A/B analysis.
Not all useful signals should become KPIs; avoid elevating high-cardinality traces and vanity metrics into decision metrics. Vanity metrics inflate dashboards and dilute attention—daily pageviews that never change product behavior are classic noise. That said, some high-cardinality diagnostics are essential for root cause analysis, so we separate diagnostics from KPIs: diagnostics live in observability tooling, while KPIs are aggregate and stable. Maintain both, but only surface the aggregated, decision-ready KPI to leadership and alerting pipelines to prevent alert fatigue and misaligned remediation.
Operationalizing KPI ownership is how you keep definitions stable and reliable across teams. Assign metric ownership with a clear runbook: define when to silence alerts, who can approve schema changes, and a CI gate that runs reconciliation tests comparing raw_events to aggregated metrics. Enforce schema and naming with a registry and pre-commit linting so instrumentation changes fail early, and include a simple parity test in PRs that changes related event emitters. Metric ownership plus these automation patterns turns KPIs from ad-hoc dashboards into programmatic contracts.
How do you tie an observed KPI delta to a business decision quickly? Translate percentage deltas into dollars or minutes using a short formula—delta_revenue = (conv_post – conv_pre) * average_order_value * baseline_traffic—and include that translation in the KPI’s runbook so the on-call can evaluate impact instantly. Pair that with a small canary or shadow pipeline to rule out instrumentation noise before executing the business action. When we quantify impact in the alert itself, we remove guesswork: the person on call can decide to roll back, escalate, or monitor with clear ROI context.
Building on the audit and naming work we’ve done earlier, treat this canonical KPI pruning as a short governance sprint: codify 3–5 actionable KPIs, assign owners, add CI reconciliation, and wire alerts only to those KPIs with clear runbooks. This focused discipline reduces noise, accelerates decision-making, and makes your analytics a direct lever for product and finance choices—next, we’ll convert these canonical definitions into prioritized remediation steps you can execute in 24–72 hours.
Automate Monitoring and Alerts
Noisy dashboards and missed regressions cost you hours of investigation and real dollars; your monitoring and alerts must act like a reliable safety net, not a siren factory. If your team spends the first hour of every incident asking whether telemetry is honest, you lose revenue and cadence. Start by assuming alerts are a workflow problem: we want fewer, faster, and business-oriented notifications that point straight to an owner and an action.
Building on the canonical-KPI and audit work earlier, the first operational rule is ownership and context: attach a single metric owner, a short runbook, and a one-line business impact to every alert. That owner should be able to answer “what decision does this alert trigger?” and execute it within its deployment window. When we codify intent (rollback, throttle, page, or ignore), alerts become actionable automations instead of vague noise, and you reduce time-to-resolution because responders already have the context they need.
Automate reconciliation and sanity checks so alerts are backed by parity tests before they fire in production. For example, run a CI job that compares raw_event counts to derived KPIs over the last 1–24 hours and fail the pipeline if counts diverge beyond tolerance; run those checks on deploy and add a nightly parity job that feeds alert state. How do you avoid alert fatigue while still catching regressions quickly? Use dual pipelines and small canaries: shadow-write raw events to immutable storage, run parallel aggregation, and compare growth in unique labels and ingest rates before promoting a change.
Make alert rules intent-driven and context-rich. Prefer ratio or rate-based expressions over absolute thresholds (for example, increase(errors_total[5m]) / increase(requests_total[5m]) > 0.01), and attach severity, owner, and a short remediation step in the alert payload. Implement suppression windows and automatic deduplication during deploys (suppress non-actionable low-severity alerts for a controlled rollout), and use dynamic baselining or burn-rate detection for traffic-dependent KPIs so you catch true regressions without firing during normal variability.
Treat alert automation as part of your CI/CD pipeline: test, lint, and simulate alerts in staging so changes to instrumentation or thresholds fail PRs. We recommend a pre-commit or server-side check that validates event names, label cardinality, and alert expressions against the canonical inventory; integrate synthetic traffic generators to trigger the alert and validate runbook instructions. When alerts are first-class artifacts in your repos, you get audit trails, rollbacks, and automated migration paths for rule changes—this is how you keep alert drift from reintroducing messy metrics.
Finally, operationalize prioritization and cost-awareness so alerts map to business impact and operational cost. Route high-severity alerts to a paging channel with a dollar-impact summary, and route diagnostics to a low-noise channel for on-call review; measure the mean time to acknowledge per alert type and tune thresholds where acknowledgements are consistently false positives. By automating sanity checks, embedding runbooks, and enforcing CI validation, we reduce alert churn and restore trust in observability—next, we’ll translate these guardrails into a short remediation sprint you can run in 24–72 hours.