Architecture overview and design goals
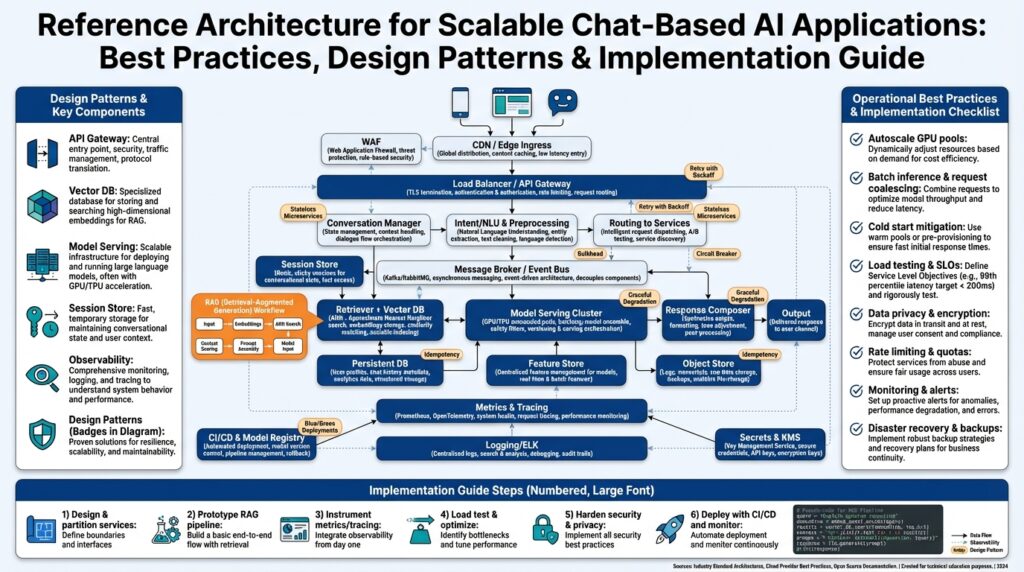
When you plan a production-grade conversational system, the most important decision is aligning architecture with measurable design goals: latency, throughput, cost, and safety. In a reference architecture for scalable chat-based AI we prioritize those goals from the outset so every component maps to an observable objective—realtime inference under 200ms P95, 99.9% availability for message ingress, and bounded cost per 1,000 messages. Stating these targets up front forces trade-offs: do you pay for reserved GPU warm pools to hit latency targets, or accept batching and slightly higher tail latency to save cost? Asking those questions early prevents costly rewrites later and keeps the design pragmatic for teams operating at scale.
A clear separation between the data plane (message flow, embeddings, retrieval) and the control plane (orchestration, routing, model lifecycle) reduces coupling and speeds iteration. We design stateless frontends to accept messages and perform authentication, while downstream workers handle heavy tasks like embedding, retrieval, and model inference. This split enables horizontal scaling: you independently scale the API layer for connection spikes and the inference layer for model-heavy work. For example, during a marketing campaign you can scale API instances with autoscaling groups without immediately provisioning additional GPUs for model serving.
Context management and retrieval are central to preserving quality as conversations grow. We recommend a hybrid approach: short-term context in a low-latency cache such as Redis for recent messages, and long-term semantic memory in a vector database for retrieval-augmented generation. When a user sends a message, we fetch recent tokens from cache and perform a k-NN lookup against the vector store to surface relevant documents and prior turns. That flow keeps the prompt size manageable while retaining the ability to reference historical context, which is critical for multi-turn dialogue and personalization.
Model serving must be treated as a tiered capability rather than a single monolith. Build a model router that selects between lightweight, quantized models for inexpensive intents and larger mixed-precision models for complex reasoning. Autoscaling GPU pools, warm instance pools, and request batching are levers you tune against your latency SLOs; batching increases throughput but raises tail latency, while warm pools reduce cold-start jitter at the expense of idle cost. Use real traffic profiling to set thresholds: route short natural-language queries to a cheap text-embedding model and reserve high-cost GPU runs for requests flagged as requiring deep reasoning.
Resilience requires explicit degradation strategies so the user experience degrades gracefully when demand exceeds capacity. Implement circuit breakers, priority queues, and backpressure on the message bus so low-priority background jobs don’t starve interactive sessions. Define fallback behaviors—return compressed context, reduce retrieval window, or switch to a smaller model—so you maintain availability over fidelity. These mechanisms stop cascading failures and let you meet uptime goals even under load or partial outages.
Observability, security, and governance must be first-class design goals, not afterthoughts. Instrument every hop with tracing and request-level metrics so you can answer questions like “What causes sudden latency spikes?” within minutes; distributed tracing helps you pinpoint whether the delay is in embedding lookup, model inference, or network. Enforce authentication, per-tenant rate limits, and data redaction pipelines to meet privacy requirements; log minimal PII, store embeddings separately from raw transcripts, and apply retention policies that align with regulations and business needs.
Building on this foundation, operational patterns complete the picture: continuous model rollout with canaries, feature flags for new retrieval policies, CI/CD pipelines for model and infrastructure changes, and cost telemetry tied to usage. We treat capacity planning as an ongoing process driven by synthetic load tests and production telemetry, not a one-time estimate. In the next section we’ll translate these goals into concrete components and deployment patterns so you can implement a reproducible, testable architecture that meets the performance and governance constraints we just described.
Core components and service responsibilities
Building on this foundation, start by mapping each runtime role to a narrowly scoped service with a single, testable responsibility. In production-grade systems we separate ingress (API gateway, authentication) from the data plane (embeddings, retrieval, model inference) and the control plane (routing, model lifecycle). That separation isn’t academic: it gives you independent scaling boundaries, clearer SLAs, and simpler failure modes for a scalable chat-based AI system. Front-load these responsibilities during design so your teams can reason about latency, cost, and observability at the service level rather than in a tangled monolith.
The public-facing API service must own authentication, request validation, and rate limiting while remaining stateless to enable rapid autoscaling. This service is responsible for initial sanity checks, tenant-aware quotas, tokenization boundaries, and mapping requests to intents or feature flags; it should never perform heavy CPU/GPU work. How do you keep the API fast under bursty load? Push short-term context into a low-latency cache at this boundary and emit lightweight traces that downstream services can correlate. Keeping the API lean preserves your ability to achieve strict P95 latency SLOs during traffic spikes.
A dedicated context manager service implements conversation state, short-term caches, and retention policies so you can assemble compact prompts for inference reliably. This service maintains recent turns in memory (Redis or equivalent), applies redaction and privacy rules, and exposes deterministic APIs to hydrate prompts; it also orchestrates fetching k most-relevant vectors from the vector database for retrieval-augmented generation. By centralizing context management you avoid duplicate logic across clients and ensure consistent prompt construction, which reduces prompt bloat and unpredictable token usage in model serving.
Embedding and retrieval responsibilities belong to a worker tier that separates synchronous low-latency lookups from async batch indexing. Workers produce embeddings, normalize vectors, and update the vector database while another service performs k-NN searches with configurable recall/latency trade-offs. Model routing decisions—whether to use a quantized small model, a mid-tier mixed-precision model, or a large GPU-backed model—should happen in a stateless model router that tags requests with cost/latency metadata. By decoupling embedding generation and retrieval from model serving, you can tune consistency, freshness, and index update cadence independently of inference capacity.
Model serving is its own responsibility domain: pool management, batching, warm instances, and graceful degradation policies live here. The model serving layer must expose predictable latency envelopes and a programmatic way to switch fallbacks (reduced context, smaller model, cached responses) when capacity is constrained. Instrument per-request cost telemetry so the control plane can autoscale GPU pools based on both throughput and monetary budgets rather than raw request count. Autoscaling decisions that consider warm pool size, acceptable tail latency, and batching efficiency will materially affect your cost per 1,000 messages while preserving user experience.
Finally, platform services—orchestration, observability, and governance—tie everything together and enforce contracts between components. The orchestration plane runs rollout strategies, canaries for new models, and cross-service feature flags; the observability plane requires distributed tracing, request-level metrics, and cost attribution so you can answer “what caused this spike?” quickly. Security and data governance services handle encryption-at-rest, PII redaction, and retention policies so each component can assume it receives already-sanitized input. With responsibilities explicitly assigned, you gain clearer ownership, faster incident response, and a reproducible path to scale—next we’ll translate these responsibilities into deployment patterns and CI/CD workflows.
Model serving and orchestration patterns
Building on this foundation, treat model serving and orchestration as two tightly coordinated layers: the runtime that executes inference and the control plane that routes, scales, and degrades models. We design the runtime to guarantee predictable latency envelopes and the control plane to make policy decisions (routing, warm pool sizing, batching). Front-load the terms: model serving and orchestration must be explicit in your SLOs and cost model so operational teams can trade latency for throughput without guesswork. This alignment makes it possible to answer questions like “When should we sacrifice context size for availability?” with measurable impact.
Start with a stateless model router that sits between the request path and your serving fleets. The router evaluates request metadata—intent classification, tenant priority, estimated token budget, and safety flags—to choose a target model and serving profile. By centralizing routing you can apply feature flags, A/B canaries, or per-tenant budget controls without changing inference containers, and you keep routing decisions cheap and reproducible. For example, route short lookup queries to a quantized CPU-backed model and flag reasoning-heavy requests for GPU-backed mixed-precision instances.
Design your serving fleets as tiered pools: cheap CPU or quantized instances for high-volume low-latency traffic, mid-tier mixed-precision nodes for balanced workloads, and reserved GPU pools for high-compute reasoning. Each pool exposes a consistent API contract but different latency/cost characteristics, so the control plane can fall back or promote requests dynamically. Autoscaling GPU pools should consider warm pool size, recent cold-start frequency, and monetary budgets rather than raw QPS; this reduces tail latency and prevents over-provisioning. We’ve found that measuring per-request cost telemetry is necessary to make these autoscaling decisions defensible.
Batching and warm instances are powerful levers, but they have trade-offs you must manage explicitly. Batching increases throughput and lowers GPU cost per token, while warm pools reduce cold-start jitter at the cost of idle spend—both affect P95 and P99 tail latency differently. Use adaptive batching windows driven by SLAs: short windows for interactive sessions, longer windows for background processing. Implement request-level deadlines and priorities so batching never blocks high-priority interactive messages behind bulk jobs.
Resilience depends on explicit degradation and circuit-breaker policies that the orchestration layer enforces. When capacity is constrained, the control plane should first apply lightweight fallbacks: compress context, reduce retrieved items, or switch to a smaller model before queuing or rejecting. Circuit breakers and priority queues protect interactive flows from background indexing and batch jobs; these mechanisms prevent cascading failures and help you maintain availability goals. Instrument each degradation path so you can measure quality loss versus availability gains quantitatively.
Container orchestration and runtime choices shape operational complexity in predictable ways. Kubernetes and similar orchestration tools give you autoscaling primitives, pod disruption budgets, and node pools, but you must add domain-specific controllers: model lifecycle controllers that pull new weights, sidecars that load-models into GPU memory, and admission controllers that verify tenant quotas. Tie rollout strategies into the orchestration plane so canaries and gradual traffic shifts are atomic and observable. Observability is non-negotiable: trace the full request from API ingress through embedding, k-NN retrieval, model routing, and inference so you can correlate spikes to specific layers.
Finally, make policies first-class and testable: encode routing, fallback, and scaling rules as configuration that the control plane can simulate and validate in CI. We run synthetic scenarios that force fallbacks, saturate GPU pools, and validate billing attribution so we can iterate on policies without risking production. Taking this approach ensures model serving and orchestration behave predictably under load and gives your team the levers to tune latency, throughput, and cost as the application evolves.
Data retrieval and vector store integration
Building on this foundation, reliable data retrieval and tight vector store integration are the linchpin that turn short conversation context into meaningful, grounded responses. Data retrieval and vector store are not an afterthought; they determine relevance, prompt size, and downstream model cost within retrieval-augmented generation workflows. When you fetch embeddings, perform k-NN lookups, and hydrate prompts you directly affect latency and quality; getting this path right is the difference between accurate assistive replies and noisy hallucinations.
Start by treating embeddings as a first-class, versioned artifact and separate short-term context from long-term semantic memory. For short-term context we keep recent turns in a low-latency cache (Redis or an in-memory store) and for long-term recall we rely on a vector store that supports approximate nearest neighbor search. How do you balance freshness and throughput? Use synchronous k-NN for interactive sessions where P95 latency matters and asynchronous batch indexing for background ingestion so you can trade immediate consistency for index build cost and throughput.
Indexing strategy in the vector store drives your retrieval trade-offs, so choose structure based on SLOs. Flat or brute-force indexes give highest recall but at GPU/CPU cost; quantized IVF or HNSW graph indexes reduce latency with acceptable recall loss for many applications. Normalize vectors and store stable metadata keys (document id, tenant id, embedding-version) so upserts are idempotent and you can safely reindex without corrupting relevancy. By separating online lookups from offline reindexing you avoid blocking interactive inference during heavy ingest.
Integrate embeddings generation with careful batching and backpressure control so you don’t overwhelm the vector store or your model-serving pools. Generate embeddings in compact batches, tag each vector with schema metadata (for example embedding_version: 2, source: transcript, ts: 2025-11-03) and perform upsert(vector, id, metadata) semantics that are idempotent on retries. Implement per-tenant namespaces and rate limits inside the vector store to enforce quotas and make eviction policies predictable. Feature-flag retrieval policies at the router level so you can A/B test retrieval count, distance metric, or query expansion without code-level rollouts.
Tune retrieval parameters with measurable objectives rather than intuition: select k, distance metric, and score thresholds based on end-to-end metrics (answer accuracy, hallucination frequency, and latency). Compare cosine similarity and dot-product for your embedding model and measure retrieval precision@k and recall@k against a labeled sample of conversations. Instrument the pipeline: log retrieval latency, vector store hit rate, and the posterior usage of retrieved docs in prompts so you can quantify quality-vs-cost trade-offs and automatically adjust k or fallback thresholds when latency budgets are tight.
Finally, connect retrieval telemetry to the model router and control plane so policy decisions are observable and repeatable. Tag each inference request with retrieval metadata (number of vectors used, retrieval latency, embedding version) so the router can decide to compress context, reduce retrieved items, or route to a cheaper model when necessary. This observability lets you encode tested fallbacks into orchestration rules and simulate degradation in CI before it hits production, which keeps availability within SLOs while preserving as much context and fidelity as possible as demand fluctuates.
Scaling, load balancing, and caching
When traffic spikes and inference costs climb, the architecture choices you make for scaling, load balancing, and caching determine whether your chat service survives with dignity or collapses under tail latency. We start with measurable goals—P95 latency, cost per 1,000 messages, and availability—and use those objectives to drive every decision about instance pools, routing, and short-term state. As we discussed earlier, separating the data plane from the control plane gives you independent levers for capacity and cost, and here those levers become concrete: autoscaling rules, traffic distribution strategies, and cache tiers that protect interactive workloads.
A clear scaling strategy begins by distinguishing elastic, stateless frontends from stateful, resource-heavy inference pools. You should autoscale API instances on request concurrency and recent 1-minute p95 latency, while scaling model-serving pools on GPU utilization, queue depth, and a custom per-request cost metric we emit. Horizontal scaling across identical stateless replicas preserves availability, and vertical scaling (bigger nodes) is appropriate only for constrained stateful services. Implement warm instance pools for GPU-backed models to reduce cold-start jitter and use adaptive batching windows so you trade throughput for acceptable tail latency when demand allows.
Traffic distribution must protect critical interactive flows and route different intents to appropriate compute tiers. Choose an L4 load balancer for raw TCP performance and an L7 reverse proxy when you need content-aware routing, sticky sessions, or header-based tenant routing; implement health checks that validate both container liveness and model readiness. For example, the model router can tag requests with intent and priority, and the ingress proxy can route long-reasoning requests to reserved GPU pools while sending lookups to quantized CPU instances. How do you prevent low-priority batch jobs from starving interactive sessions? Enforce priority queues and circuit breakers in the router so high-priority requests skip bulk queues entirely.
Short-term context caching is where you cut round-trips and token cost without weakening quality. Keep recent conversation turns and user session state in a low-latency store like Redis with bounded TTLs and size limits; store only compact tokenized summaries or deltas to avoid prompt bloat. Use cache stampede protection (simple distributed lock or singleflight pattern) to prevent thundering herds when a cold key is requested. Example pattern for a singleflight-like fetch:
val = redis.get(key)
if not val:
    if redis.setnx(lock_key, 1, ex=5):
        val = fetch_and_compute()
        redis.set(key, val, ex=ttl)
        redis.delete(lock_key)
    else:
        val = wait_for_value(key)
Caching works best combined with metadata-versioned keys; tag short-term keys with embedding_version and context_window so you can invalidate deterministically when retrieval policies change. For longer-term recall we rely on vector-store retrieval as previously described, but avoid mixing the two: synchronous Redis lookups for recent turns, k-NN lookups for semantic memory. This separation lets you shrink prompt size quickly under load—trim recent cached turns, reduce k, and switch to a cheaper model rather than rejecting requests.
Operationally, tie autoscaling and load-balancer policies to the same observability signals you use for SLOs. Emit request-level traces that include retrieval latency, cache hit/miss, model selection, and per-request cost; then drive Horizontal Pod Autoscalers (or your cloud autoscaler) from custom metrics like GPU memory pressure, average inference latency, and the fraction of warm-instance hits. We run synthetic load tests that exercise degradation rules—verify that when inference pools saturate, the system applies fallbacks (context compression, fewer retrieved docs, smaller model) within defined blast-radius limits, and measure quality loss versus availability gains.
Taking these practices together gives you practical levers to control cost and preserve UX under pressure. By using conservative cache TTLs, versioned keys, priority-aware routing, and metric-driven autoscaling we can maintain strict latency SLOs while scaling cost predictably. Next, we’ll translate these operational rules into concrete deployment manifests and CI tests that validate fallback correctness and autoscaling behavior before changes reach production.
Monitoring, security, and operational governance
Building on this foundation, monitoring, observability, and operational governance become the guardrails that keep a chat-based AI system safe, performant, and auditable. We instrument the entire request path—from API ingress through embedding generation, k‑NN retrieval, model routing, and inference—so you can correlate SLO violations with concrete component behavior quickly. Monitoring and tracing are not optional telemetry; they are the control signals for automated fallbacks, cost-aware autoscaling, and security enforcement. When you can answer “what caused this spike?” within minutes, you reduce blast radius and mean time to resolution dramatically.
Design observability for actionability rather than completeness. Emit structured request-level metrics like inference_latency_ms, retrieval_latency_ms, embedding_version, model_id, and cost_per_request_usd, and tie those to distributed traces that include span attributes for tenant_id and priority. Logs should be structured and redaction-aware so you can debug without exposing PII; use correlation IDs across services to rehydrate traces and reconstruct a request end-to-end. Instrumentation must be lightweight in hot paths—sample traces for high-volume traffic and use full traces for canaries and error cases—so monitoring itself doesn’t become a scaling bottleneck.
Security controls and data governance must be woven into runtime and tooling, not bolted on later. Enforce tenant isolation with per-tenant namespaces in storage and vector indexes, apply RBAC for platform actions, and centralize key management with automated rotation via a KMS. Apply PII redaction and schema-level tokenization in the context manager before any data reaches the vector store or model serving fleet, store embeddings separately from raw transcripts, and implement retention policies that are enforceable and auditable. For compliance, log access and admin actions with immutable audit trails and run regular access reviews to validate principle-of-least-privilege.
Model governance covers lineage, validation, and safety checks for every artifact you serve. Version models and embeddings as first-class artifacts, track training data and evaluation datasets, and gate rollouts with automated tests that verify latency, quality, and safety metrics against a labeled validation set. How do you detect model drift before it affects users? We recommend continual shadow testing: route a sampled copy of production traffic to candidate models, measure drift on precision/recall and hallucination rates, and trigger automated rollback or retraining when thresholds exceed acceptable bounds. Pair canary deployments with feature flags so you can quickly toggle retrieval policies or fallback behaviors without code changes.
Operational governance aligns people, policies, and automation so incidents are reproducible and learning is institutionalized. Encode SLOs and escalation policies as machine-readable rules that trigger runbooks and incident channels when burn rates cross thresholds; integrate cost telemetry into incident context so you understand trade-offs between latency and spend. Maintain runbooks that include verified remediation steps—circuit-breaker resets, cache invalidation, model rollback commands—and rehearse them with simulated incidents and game days. Regular audits of deployment permissions, dependency vulnerabilities, and third-party data flows keep your security posture defensible.
Automate policy-as-code and validation in CI/CD to prevent regressions from reaching production. Include infrastructure-as-code checks that validate encryption settings, network egress rules, and pod security contexts; add model-specific gates that run safety classifiers, toxicity filters, and retrieval-accuracy tests before a model artifact is promoted. Use synthetic monitoring and chaos tests in staging to validate degradation paths—verify that context compression, reduced-k retrieval, and smaller-model fallbacks preserve availability within agreed SLOs. Secrets rotation, dependency scanning, and vulnerability patching should be part of every pipeline run so operational risk is reduced continuously.
Make observability actionable with closed-loop automation: when tracing shows the embedding lookup is the critical path during a latency spike, the control plane should automatically reduce k, promote cached context, or route to a cheaper model while emitting an incident note. That sequence—detect, decide, degrade, and notify—should be instrumented and testable so you can quantify quality loss versus availability gain. By tying monitoring, security, and governance into the same telemetry and policy systems, we keep the system resilient and auditable without slowing iteration.
Taking these practices together, monitoring and security become operational levers rather than checklist items. We treat governance as code, observability as policy input, and incident response as rehearsed automation so the architecture scales predictably and safely. Next, we’ll translate these governance rules into deployment manifests and CI tests that validate fallback correctness and autoscaling behavior before changes reach production.