Objectives and Success Criteria
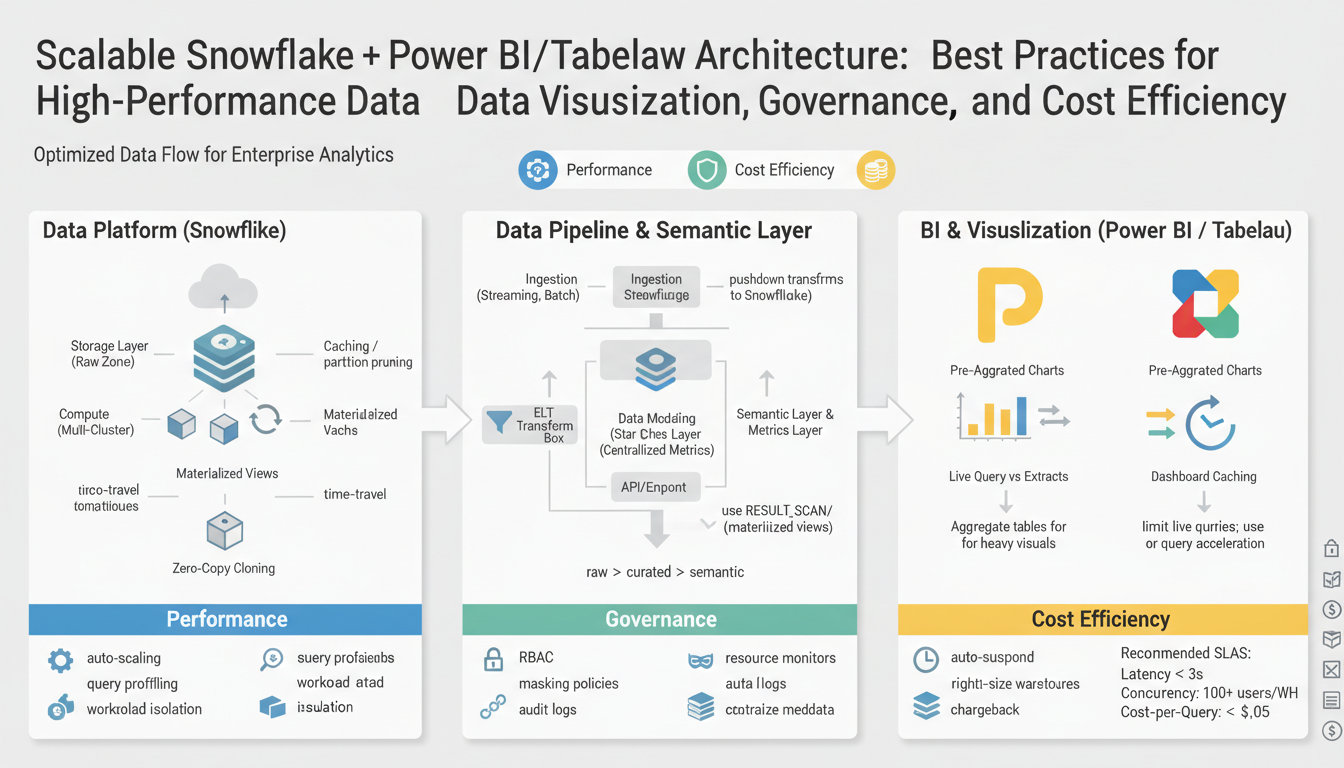
Building on this foundation, our immediate priorities center on Snowflake-driven data pipelines feeding fast, governed visualizations in Power BI and Tableau while keeping cost efficiency and scalability measurable. We want you to think in outcomes: predictable dashboard response under load, reproducible data lineage for audits, and a cost model that aligns Snowflake credits with business value. These core concepts — Snowflake, Power BI, Tableau, data visualization, governance, cost efficiency, and scalable architecture — should appear in your acceptance criteria from day one so teams know which targets to hit and why they matter.
Start by defining performance and scalability objectives as concrete service-level goals. For example, specify P95 query response times for exploratory queries, maximum dashboard load time under typical concurrency, and concurrent active user targets for Power BI and Tableau Server/Online. State refresh windows for incremental pipelines and maximum acceptable staleness (for instance, a 15-minute SLA for operational dashboards versus a 24-hour SLA for strategic reports). These measurable goals let engineering and analytics teams make engineering trade-offs—caching, materialized views, or larger virtual warehouses—based on agreed tolerances.
Next, make governance and data quality first-class objectives with explicit success metrics. Require end-to-end lineage and discoverability for 100% of datasets used in production dashboards, enforce row-level security and role-based access controls, and measure time-to-issue-resolution for data incidents. Track metadata coverage in your catalog and validate schema contracts via automated tests on CI pipelines. When governance targets are numeric and time-bound, compliance reviews and audit reporting become operational tasks rather than manual firefights.
Cost efficiency must be defined by both absolute and relative metrics so you can optimize without harming performance. Set a target for Snowflake credits per reporting unit (for example, credits/day per 1,000 active users), define an acceptable cost-per-query range, and report month-over-month variance. Combine these with utilization thresholds for virtual warehouses and automated resource monitors that trigger scaling or suspensions. This gives you a feedback loop: if cost spikes without corresponding business value, you immediately investigate query patterns, cache effectiveness, or dashboard design.
How do you observe and prove success? Instrumentation and observability are required acceptance criteria. Implement dashboards that correlate Snowflake query metrics (latency, credits, concurrency), Power BI/ Tableau load metrics (first-paint time, interactivity), and data freshness indicators. Include synthetic transaction tests that run representative queries and synthetic dashboard loads every hour, and expose their results to SLO dashboards. Add alerting on SLA breaches and automated playbooks that route incidents to owners—this turns subjective complaints into verifiable SLO incidents.
To make this tangible, use a real-world scenario: for a retail analytics stack serving 500 concurrent users, aim for P95 dashboard interaction <2.5s, daily ETL completion within a 2-hour window, end-to-end lineage coverage >95%, and a 5% month-over-month credit consumption growth cap. Validate these through load tests, resource-monitor alerts, and scheduled audits. Meeting these criteria demonstrates a balanced architecture that serves fast, scalable data visualization while maintaining governance and cost efficiency—preparing us to move into implementation patterns and tuning strategies in the following section.
Snowflake Architectural Patterns
Building on this foundation, the most robust Snowflake architectures treat the platform as the center of a predictable, governed pipeline that feeds Power BI and Tableau while optimizing for cost efficiency and fast data visualization. Start by defining logical layers—landing, raw, curated, and semantic—so you can isolate long-running transforms from interactive query workloads. This layered approach gives you clear SLOs for P95 exploratory query latency and dashboard interactivity, and it makes it easier to reason about governance and lineage because each layer has a single responsibility and a well-defined schema contract.
A common high-performance pattern is to separate storage and compute workloads with purpose-built virtual warehouses. Create dedicated warehouses for ETL (large, transient clusters), for interactive BI extracts (multi-cluster warehouses with auto-scale), and for ad-hoc analytics (smaller, cost-sensitive warehouses). This separation ensures Tableau and Power BI queries don’t compete with bulk loads, and it allows resource monitors to suspend or scale warehouses automatically to preserve cost efficiency. When you need consistent low-latency dashboard responses under concurrency, favor short-lived, horizontally scaled warehouses over one oversized cluster.
For query performance on dashboard-critical tables, combine Snowflake micro-partitioning and clustering keys with materialized views and result-set caching. Micro-partitions optimize storage-level pruning; clustering keys (explicit clustering or automatic clustering) help when predicates are highly selective. Materialized views precompute expensive joins and aggregations for fast reads, while result-set caching handles repeated identical queries. When should you choose a materialized view over result-set caching? Use materialized views when the dataset is large, the aggregation is expensive, and you can tolerate the maintenance cost; rely on caching for highly repetitive, identical queries from dashboards.
Streaming and incremental patterns keep freshness high without blowing up compute. Implement Snowflake Streams (change data capture) plus Tasks (scheduler) to apply incremental transforms rather than full-table rebuilds; this reduces credits and shortens ETL windows. Use zero-copy cloning for safe, low-cost development and test environments so you can validate schema changes and lineage without duplicating storage. Example incremental task pattern: create a Stream on the source table, then a Task that MERGEs new rows into the curated table on a schedule aligned to your SLA (for example, every 5 minutes for operational dashboards).
Security and governance patterns belong in the architecture from day one. Implement row access policies and masking policies to enforce fine-grained access for Power BI and Tableau users; expose only secure views to BI tools instead of base tables so you can centrally manage RBAC and auditing. Catalog and lineage tools should harvest objects and track ownership across the landing→curated→semantic flow so you can meet audit requirements and measure metadata coverage. Make data quality gates part of CI pipelines—fail a deployment on schema drift, enforce unit tests for transformations, and monitor time-to-issue-resolution as a governance SLA.
Observability, cost controls, and traceability close the feedback loop for a scalable architecture. Correlate Snowflake credits, warehouse utilization, and query latency with Power BI/Tableau load metrics in an SLO dashboard; run synthetic dashboard loads and representative queries to validate P95 targets. Tie resource monitors and automated throttles to cost efficiency goals so credit spikes trigger investigation rather than surprise invoices. Taking these patterns together—layered data models, compute separation, incremental pipelines, secure semantic layers, and rigorous observability—lets us design a Snowflake-driven stack that consistently delivers fast data visualization, strong governance, and predictable cost control as we move into implementation and tuning strategies.
Data Modeling Best Practices
Building on this foundation, the data model is the single biggest lever we have to deliver predictable, low-latency dashboards in Snowflake-powered pipelines feeding Power BI and Tableau while keeping governance and cost efficiency measurable. You should treat the model as an engineering contract: it determines query shape, cacheability, and how easily you can enforce row-level security and lineage. Early design decisions—schema shape, grain, and aggregation strategy—directly affect P95 response times for interactive queries and the Snowflake credits consumed under concurrency.
Start model design by asking the right question: which workloads will read this data and with what SLAs? For example, what you build for high-concurrency operational dashboards (15-minute freshness, sub-2.5s interactivity for Power BI/Tableau) differs from a nightly strategic report with a 24-hour SLA. Choose a star schema for analytical workloads that require flexible slicing and dicing: fact tables at a single grain with conformed dimension tables reduce join multiplicity in BI tools and make measures reproducible. In contrast, favor a denormalized wide table when you need ultra-fast single-row reads for high-cardinality dashboards and when extracts in Power BI or Tableau will be refreshed frequently; this reduces join overhead at query time but increases storage and ETL maintenance work.
For physical layout in Snowflake, design tables to exploit micro-partition pruning and clustering so that predicate-heavy dashboard queries scan minimal data. Define a clear grain and clustering key where predicates are most selective—order_date, customer_id, or geo_id—so Snowflake can prune partitions effectively. Use materialized views for expensive, stable aggregations that are accessed by many dashboards, and prefer result-set caching for repetitive identical queries from embedded dashboards; materialized views cost maintenance credits while caching is cost-free until query variance grows. When you implement these patterns, monitor query profiles and credit usage to validate that clustering and materialized views produce net cost savings.
Make security and governance part of the model by exposing secure, versioned semantic views instead of raw tables to Power BI and Tableau. Implement row access policies and masking policies at the Snowflake object layer so that BI tools inherit enforced access without embedding filters in reports. Register every semantic view in your catalog with ownership, SLA, and lineage metadata so that audits and data incident triage become consultable actions rather than manual discovery. This approach ties the model to governance SLAs and reduces time-to-issue-resolution because the semantic layer is the single source of truth for both analysts and auditors.
Balance performance and cost by combining modeling with operational patterns: build aggregated summary tables at business-friendly grains for fast visualization while keeping narrow, change-capture-friendly fact tables for incremental ETL. Use Streams and Tasks to apply CDC-based merges into curated facts so you avoid full-table rebuilds that spike Snowflake credits. For dashboards in Power BI and Tableau, prefer configured extracts or published aggregates for heavy concurrency and leave interactive ad-hoc slices to live connections where freshness matters more than concurrency. Measure credits per reporting unit and correlate that with dashboard P95 and data freshness to make evidence-based trade-offs.
Taken together, these modeling choices create a predictable path from landing to semantic layer that optimizes for data visualization performance, governance, and cost efficiency in a scalable architecture. As we move into implementation patterns and tuning strategies, we’ll convert these modeling contracts into CI tests, automated lineage checks, and workload-driven warehouse sizing so you can validate SLOs under load and control Snowflake credit growth.
Query Performance and Caching
Unpredictable dashboard latency is the symptom; the root causes are query shape, cache strategy, and warehouse contention. When Power BI or Tableau users complain about slow interactions, you need a reproducible way to diagnose whether the cost comes from Snowflake compute, expensive joins, or simply poor cacheability of the SQL patterns behind your semantic layer. How do you guarantee predictable interactive response times while preserving governance and cost efficiency in a scalable architecture? We start by treating caching as a set of layered controls, not a single toggle.
Treat Snowflake result caching, materialized objects, and warehouse-local caching as complementary tools with clear trade-offs. Result-set cache is essentially free—Snowflake returns identical query results from cache if the underlying data and session context haven’t changed—so it’s ideal for identical dashboard queries where parameters are stable. Materialized views and aggregated summary tables precompute work and surface consistent shapes to Power BI and Tableau; they cost maintenance credits on refresh but dramatically reduce per-query CPU for heavy aggregations. For example, create a materialized view for monthly revenue aggregation instead of re-aggregating millions of rows per dashboard render:
CREATE MATERIALIZED VIEW mv_monthly_revenue AS
SELECT store_id, date_trunc('month', order_date) month, SUM(amount) revenue
FROM curated.orders
GROUP BY store_id, month;
Use that materialized view for extracts or live queries when many dashboards slice the same dimensions.
Design table layout to maximize micro-partition pruning and selective clustering so that live queries scan minimal bytes. Define clustering keys on predicates that appear most often in dashboard filters—order_date, customer_id, geo_id—and monitor the effective benefits by comparing scanned bytes pre- and post-clustering. Automatic clustering handles background maintenance but pay attention to maintenance credit costs; explicit clustering is worthwhile when you control ingestion patterns and can amortize reclustering. In practice, a fact table clustered by (order_date, customer_id) will drop scanned bytes dramatically for date-bounded dashboard queries and reduce Snowflake credits per interactive session.
Decide where Power BI and Tableau should use extracts versus live connections based on concurrency and freshness SLAs. Extracts (Power BI dataflows, Tableau Hyper extracts) are excellent for high-concurrency, read-heavy dashboards because they shift load off Snowflake and let you control refresh windows; live connections are preferable when freshness (minutes) matters for operational views. When should you prefer extracts over live queries? Choose extracts when you need predictable P95 interaction under load, and choose live for low-concurrency dashboards with strict data-recentness requirements. Implement incremental refresh patterns for extracts and publish aggregated extracts aligned to business-friendly grains to minimize refresh cost and maximize interactivity.
Operationalize caching behavior and test it under realistic load so governance and cost efficiency are measurable. Instrument SLO dashboards that correlate Snowflake query latency, scanned bytes, and credits with Power BI/Tableau first-paint and interactivity times. Schedule synthetic transactions that run representative queries and dashboard flows after each ETL cycle and whenever a schema or clustering change is deployed; treat synthetic failures like SLO incidents. Tie resource monitors to automated actions—scale multi-cluster warehouses for predictable concurrency, suspend idle warehouses to save credits—and use alerts to investigate sudden cache invalidation or query plan regressions.
These tactics give you pragmatic rules of thumb: favor result-set caching and extracts for repeated, identical dashboard queries; use materialized views and clustering where aggregations and predicates are stable; and combine synthetic testing with cost monitors so Snowflake credit spend maps to business value. By aligning these choices with governance metadata and observable SLOs, we preserve auditability and deliver predictable data visualization performance across Power BI and Tableau in a truly scalable architecture.
Power BI and Tableau Integration
Building on this foundation, the practical integration of Power BI and Tableau with Snowflake is where performance, governance, and cost efficiency either converge or diverge in production. Start by treating the BI tool layer as an engineered surface: define the SLAs you need for dashboard interactivity and freshness, then map those SLAs to concrete Snowflake patterns and BI configurations so you can make reproducible trade-offs. This focus turns vague requests like “speed up dashboards” into measurable objectives—P95 interaction time, refresh windows, and allowable staleness—that guide whether you choose extracts, live queries, or hybrid approaches for Power BI and Tableau.
The most impactful decision you’ll make is extracts versus live connections because it determines compute placement and concurrency characteristics. Use extracts (Power BI dataflows / incremental refresh, Tableau Hyper extracts) when you need predictable P95 response under high concurrency; extracts shift compute off Snowflake at read-time and let you schedule refresh windows aligned to cost-efficiency goals. Conversely, choose live connections when sub-15-minute freshness matters and user concurrency is modest; in that case you should provision multi-cluster warehouses with auto-scale to isolate BI workloads from ETL. How do you reconcile live queries and extracts while keeping Snowflake credits in check? We balance them by classifying dashboards by SLA and then applying a repeatable pattern: extracts for high-concurrency, stable-aggregation dashboards; live for operational views with tight freshness requirements.
Design the semantic layer that Power BI and Tableau consume as a secure contract, not a collection of convenience views. Expose curated semantic views in Snowflake that encapsulate joins, RBAC, and masking policies so dashboards inherit governance by design. Implement row access policies and masking policies at the Snowflake object layer and publish only those views to Tableau Server/Online and Power BI service; this centralizes auditing and reduces report-level filter sprawl. For example, publish a versioned semantic view view_sales_v2 that flattens commonly joined dimensions and enforces a row_access_policy, then point extracts or live connections in your BI tools at that single object to maintain lineage and repeatability.
Operational tuning is both a query-shape and a BI-configuration exercise. Shape queries in your semantic layer to be cache-friendly—stable aggregations, deterministic predicates, and parameterized queries that hit result-set cache where possible—and align that with Power BI parameterization or Tableau initial SQL so identical queries are repeatable. Use materialized aggregates in Snowflake for expensive groupings and configure Tableau to use those aggregates as published data sources or set Power BI to import aggregated tables into dataflows. On the refresh side, enable incremental refresh in Power BI and partitioned Hyper extracts in Tableau so you avoid full-table rebuilds that spike credits and lengthen ETL windows.
Observability ties the architecture together and makes governance actionable. Instrument and correlate Snowflake query metrics (latency, scanned bytes, credits) with BI telemetry (first-paint, interactivity, refresh duration) in a single SLO dashboard so we can spot regressions quickly. Schedule synthetic dashboard loads after each ETL cycle and whenever schema changes are deployed to validate P95 targets; treat synthetic failures as SLO incidents and tie them to runbooks that include quick rollback paths for semantic view changes. Track credits-per-reporting-unit and map unexpected increases to query patterns, missing indexes/ clustering, or extract refresh anomalies—this makes cost efficiency measurable rather than anecdotal.
Putting these pieces together lets you deliver predictable, governed data visualization at scale with clear levers to trade freshness, concurrency, and cost. The next step is to codify these patterns into CI checks for semantic views, automated tests for incremental extract refreshes, and standardized templates for warehouse sizing so teams can deploy Power BI and Tableau assets with reproducible performance and auditable lineage in a scalable architecture.
Governance, Security, Cost Controls
Building on this foundation, the practical challenge is turning governance, security, and cost controls into operational products that reliably protect data, preserve performance for Power BI and Tableau, and keep Snowflake credit spend predictable. We want measurable outcomes you can test: lineage coverage, enforced access, and a cost allocation model that ties credits to dashboard business value. Start by treating the semantic layer and catalog as active controls rather than passive documentation — that shifts governance from checkbox compliance to an engineering responsibility we can measure and improve.
Make metadata and lineage non-optional so audits and triage are fast and reproducible. Require every production semantic view to have ownership, SLA, schema contract, and automated lineage harvested into your catalog; enforce these with CI gates that fail a deployment if metadata coverage or lineage falls below the threshold. For example, configure your pipeline to fail when a deployment exposes a new table to Power BI or Tableau without a registered owner and a linked data quality test. Tracking time-to-resolution for data incidents and percentage lineage coverage converts governance into KPIs you can report and operate against.
Treat fine-grained access policies and masking as central to your security model, not an afterthought layered in reports. Implement Snowflake row access policies and masking policies on semantic views so Power BI and Tableau inherit the same enforcement model across extracts and live connections. Rotate service credentials and prefer delegated OAuth/SAML for BI service accounts, and scope them by minimal privileges; for example, publish a view that flattens joins and attach a row_access_policy so analysts never query base tables directly. Combine these policies with network controls, session policies, and short-lived tokens to reduce blast radius and to make audits reproducible.
Cost controls must be explicit, automated, and tied to business metrics if you expect cost efficiency to scale. Define credit budgets and cost-per-reporting-unit targets, then implement Snowflake resource monitors that suspend or scale warehouses and emit alerts on threshold breaches. Automate actions: suspend large ETL warehouses after their windows, auto-scale BI warehouses under load spikes, and enforce credit caps for dev/test clones. Instrument credits-per-query and credits-per-dashboard in your billing pipeline so we can correlate spend with dashboard adoption and determine whether a materialized view or extract yields net savings.
Observability is the glue that lets governance, security, and cost controls act coherently in a scalable architecture. Correlate Snowflake metrics (credits, scanned bytes, query latency) with Power BI/Tableau telemetry (first-paint, interactivity, refresh duration) in a single SLO dashboard and run synthetic dashboard transactions hourly. How do you map a spike in credits to a specific dashboard? Use request IDs or semantic-view tags: tag queries from each published view, capture the tag in query history, and join billing data to BI telemetry to identify the offending dashboard and its SQL shape. Treat synthetic failures as SLO incidents with runbooks that include immediate mitigation (rollback view, suspend warehouse, or revert extract refresh).
Taking these controls together gives you the levered ability to defend data, preserve performance, and keep costs aligned with value as you scale Snowflake-backed data visualization for Power BI and Tableau. In the next section we’ll convert these operational patterns into CI/CD checks, automated remediation playbooks, and tuning recipes for warehouse sizing so teams can deploy semantic views and extracts with reproducible SLAs and auditable cost outcomes.
