Define goals and success metrics
Start by tying analytics objectives to concrete business outcomes: what decision will change, who will act on it, and how much value that change creates. Convert those outcomes into 3–5 measurable success metrics that mix business impact (conversion lift, retention delta, revenue per user) with operational observables (time‑to‑insight, data freshness, query cost, and adoption). Always include baseline values and timebound targets—for example, reduce time‑to‑insight for product experiments from 72 hours to under 4 hours in 90 days; achieve a weekly self‑serve adoption rate of 50% among product analysts within one quarter.
Specify how each metric is measured, where the telemetry lives, and who owns it. Instrument dashboards and lightweight SLIs (service level indicators) so metrics are computed automatically and auditable; set clear SLOs (e.g., data freshness <15 minutes 99% of the time, row‑level data error rate <0.1%). Define cost constraints: target average compute per dashboard query or monthly analytics spend per analyst to keep the stack low‑overhead.
Design short feedback loops: review metrics weekly at launch, move to monthly once stable, and adjust targets with stakeholder sign‑off. Capture guardrails for tradeoffs—accept slightly higher latency if it reduces cost by X%—and log decisions so future teams understand why a metric was chosen. Clear owners, baselines, measurement method, and timebound targets turn goals into operational playbooks that let teams spin up analytics rapidly and measure their true impact.
Choose a managed analytics stack
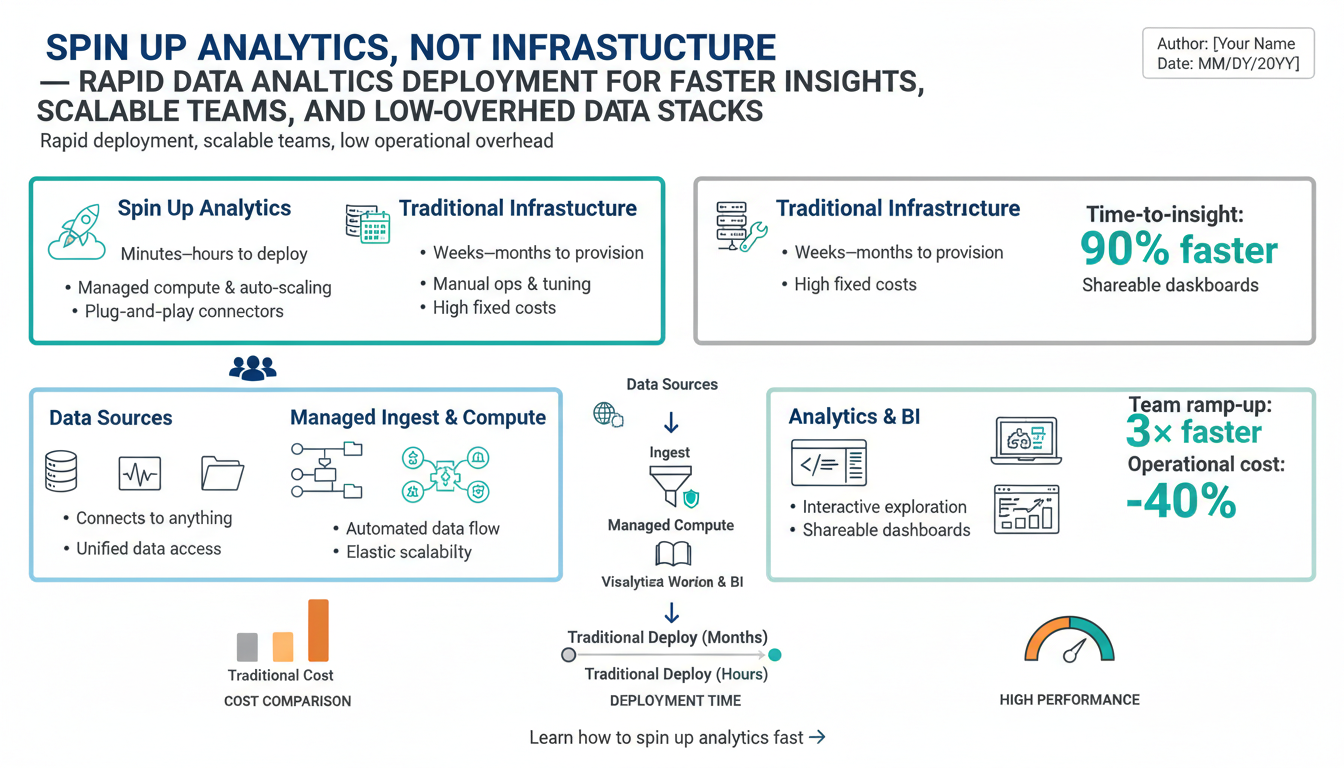
Start by picking a stack that shifts operational burden away from your team: a cloud data warehouse or managed lakehouse, a hosted ingestion layer, a SQL-first transformation engine, and a BI tool with row‑level security and self‑serve capabilities. Favor services with clear SLAs, pay‑as‑you‑go pricing, and built‑in observability so you can measure time‑to‑insight, query cost, and data freshness without running servers.
Match the stack to your team’s skills and goals. If analysts are SQL‑centric, prioritize a warehouse with strong ANSI SQL support and a transformation layer that embraces modular, testable SQL models. If you need ML or streaming, choose a managed lakehouse or a warehouse with native streaming and compute elasticity. For fast iteration, prefer managed ingestion and ELT connectors that remove pipeline maintenance and let you model in a single place.
Operationalize governance and cost controls from day one: enforce role‑based access, data cataloging, lineage, and automated freshness SLIs. Bake cost guardrails into workspace policies and query limits; track compute spend per project and set alerts. Validate portability by using open data formats (Parquet/Delta) and standard SQL schemas so you can migrate components if requirements change.
Launch with a minimal, observable configuration: 1) replicate core event and product tables via managed ingestion, 2) build a small set of tested transformation models, 3) expose key dashboards and curated datasets to analysts. Iterate by measuring adoption, query latency, and monthly spend; scale or swap managed components only when clear bottlenecks or unmet requirements appear.
Provision core services quickly
Spin up a minimally viable analytics environment by automating repeatable choices: provision a managed warehouse or lakehouse, hosted ingestion, a SQL-first transformation engine, and a BI workspace using infrastructure-as-code templates so environments are reproducible and auditable. Commit Terraform/CloudFormation modules and environment bootstrappers to a repo that creates projects, roles, network rules, SSO integration, and cost limits with a single pipeline run. Include a small set of curated, ready‑to‑query tables and a sample dashboard so analysts can run real queries immediately rather than waiting for bespoke pipelines.
Automate operational guardrails during provisioning: enforce RBAC and workspace policies, enable row‑level security, turn on built‑in lineage and freshness SLIs, and configure alerts for query cost and data latency. Wire basic observability (data freshness, failed ingestion count, median query latency) into a lightweight dashboard that’s part of the bootstrap process. Seed the stack with CI checks and smoke tests that validate ingestion, transformation results, and dashboard rendering before marking the environment ready.
Short onboarding artifacts close the loop: include query templates, a short runbook for common incidents, ownership pointers, and a “how to publish a curated model” checklist in the repo. This combination of IaC, curated defaults, automated guardrails, and baked‑in observability gets analysts querying and delivering insights in hours, not weeks.
Implement ELT and dbt
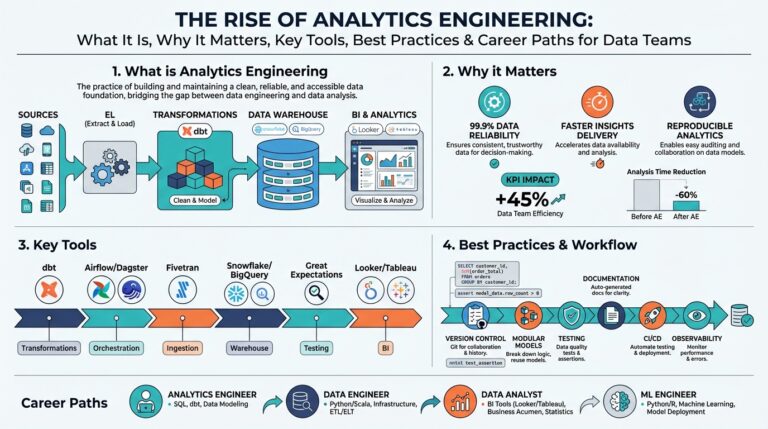
Adopt an extract‑load‑transform flow that keeps the warehouse as the single source of truth: replicate raw event, user, and product tables into a raw schema with ingestion metadata (source, load_ts, batch_id) so analysts can always reconstruct provenance. Use managed connectors or CDC for low‑maintenance ingestion and keep retention policies simple at first.
Model transformations with a SQL‑centric framework that enforces modular, testable units: build source‑to‑staging models that apply only cleaning and type coercion, then compose analytic models from those staging pieces. Prefer ephemeral views for simple joins, incremental materializations for large append‑only tables, and snapshots for slowly changing dimensions. Declare tests and metrics alongside models (unique, not_null, accepted_range) and surface failing tests in CI so data quality blocks deployments.
Automation is essential: run model builds, tests, and docs generation in a CI pipeline and gate promotion with failing‑test alerts. Schedule runs with a lightweight orchestrator or the warehouse’s scheduler; partition run frequency by SLIs (real‑time freshness for dashboards, daily for nightly aggregates). Tag models with owners, cost center, and intended SLAs to enable chargeback and accountability.
Instrument observability: emit model run durations, row counts, and freshness into an operations dashboard and set SLOs (e.g., freshness <15 minutes 99%). Optimize cost by choosing materializations consciously and using incremental logic, and iterate on tests and models as product requirements evolve.
Enable self-service analytics
Give analysts curated, low-friction pathways to answers while keeping governance and cost under control. Start by publishing certified, well‑documented datasets and a lightweight semantic layer that exposes business‑friendly names and metrics; require each certified model to include owner, freshness SLO, and a short example query so consumers know when to use it. Provide ready‑to‑use SQL templates, dashboard skeletons, and a sandbox workspace with capped compute so analysts can iterate without waiting on engineering. Automate guardrails: enforce role‑based access, row‑level security, query cost limits, and tagging for chargeback; surface model test results and lineage in the data catalog so trust is explicit. Embed onboarding artifacts—one‑page runbooks, a “query cookbook,” and a 60‑minute lab—into the repo used to provision environments so new users can run real reports within hours. Bake observability into the experience: expose adoption, median time‑to‑insight, query cost per user, and model freshness on an internal dashboard and review them weekly to detect friction. Create a lightweight certification process for new models (tests, docs, owner sign‑off) and a champion program that pairs new analysts with experienced peers. Iterate on access patterns and curated datasets using adoption and cost SLIs: widen self‑serve scope where adoption and accuracy are high, tighten controls where cost or data quality signals warn of risk. This combination speeds insight delivery while preserving reliability and predictable operating cost.
Monitor, optimize, and scale
Treat observability as a product: instrument SLIs that map to decision velocity and cost—examples include data_freshness, median_dashboard_latency, query_cost_per_user, failing_test_rate, and weekly self‑serve adoption. Expose these in an operations dashboard with alerting and on‑call ownership so regressions trigger a playbook rather than a fire drill. Use concrete SLOs (for example, data freshness <15 minutes 99%, median dashboard latency <2s for interactive slices) and surface baseline and trend lines next to targets.
Optimize where impact is highest: profile slow queries and prioritize fixes that reduce cost or time‑to‑insight. Replace wide, repeated joins with curated, incremental materializations; prefer partitioning and clustering on high‑cardinality predicates; publish aggregated rollups for common dashboards; and leverage query result caching for interactive workloads. Tag models with cost center and owner so optimization work can be charged and prioritized.
Scale by separating workloads and applying resource isolation: route interactive BI to elastic, short‑lived pools and schedule heavy batch jobs in dedicated, autoscaling clusters. Enforce sandbox compute caps, workspace quotas, and query concurrency limits to prevent noisy neighbours. Automate lifecycle policies to retire or compact old partitions and archive cold data to cheaper storage.
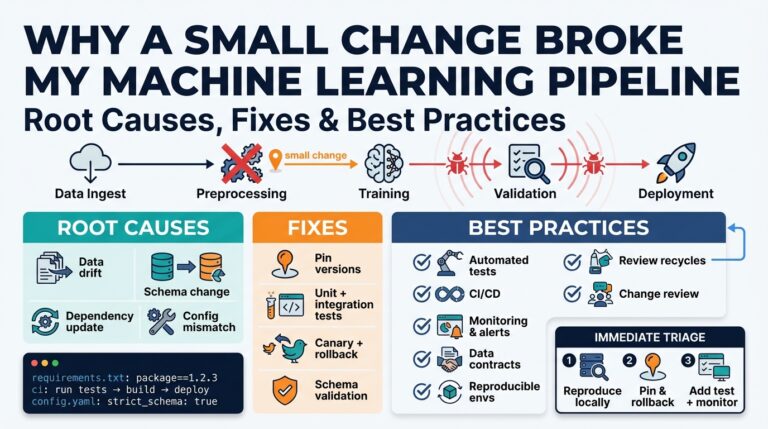
Make continuous improvement operational: run weekly launch reviews during ramp, shift to monthly once stable, and gate major changes with CI tests and canary deployments for materialized models. Capture optimization experiments (latency vs cost tradeoffs) with measurable outcomes and clear owners so scaling decisions remain reversible and auditable.
