Export your trained model
Building on this foundation, the next crucial step is to produce a portable artifact that captures your model, its preprocessing, and its runtime contract so you can export trained model artifacts reliably. We want an artifact that survives environment changes, is verifiable, and declares its inputs/outputs explicitly — that’s the difference between a model you keep on disk and a production-ready model artifact. How do you choose the right export format and what gets bundled with the weights? We’ll walk through practical rules and concrete examples so you can make that choice with confidence.
Start by deciding the serialization strategy and the model format that matches your runtime and latency needs. For PyTorch models you’ll typically choose between saving a state_dict, serializing with TorchScript (scripting or tracing), or exporting to ONNX for cross-framework inference; choose state_dict for reproducible training checkpoints, TorchScript when you need a self-contained runtime in C++/mobile, and ONNX when portability and multi-language serving matter. If your model uses Python-only constructs or dynamic control flow, prefer scripting over tracing, because scripting preserves control-flow semantics; tracing is smaller but brittle to input shape changes. Include minimal code examples in your repo and a short README that documents how to rehydrate the artifact in staging and production.
For TensorFlow-based models, export using SavedModel to preserve the full computation graph, variable values, and signature definitions; SavedModel is the recommended format for TensorFlow Serving, TFRT, and many cloud runtimes. If you must interoperate, convert SavedModel to ONNX, but retain an original SavedModel backup so you can re-train or inspect tensors. Persist any preprocessing transforms (feature normalization parameters, vocabulary files, tokenizer configs) as part of the assets directory, and export a small, deterministic example input and expected output alongside the artifact so smoke tests can run without loading the training pipeline. Example: use tf.saved_model.save(model, export_dir) and commit a versioned export folder to your model registry or object storage.
Treat metadata and contract definitions as first-class citizens when you export trained model artifacts. Create a model manifest (JSON or YAML) that declares model name, version, input schema (shape, dtype, meaning), output schema, preprocessing steps, and performance expectations (latency, memory). This manifest becomes the single source of truth for onboarding engineers and helps automated serving systems wire up converters and health checks. We recommend semantic versioning for the model artifact (MAJOR.MINOR.PATCH) and storing SHA256 checksums for both the model binary and key assets so CI/CD can detect corruption or drift during deployment.
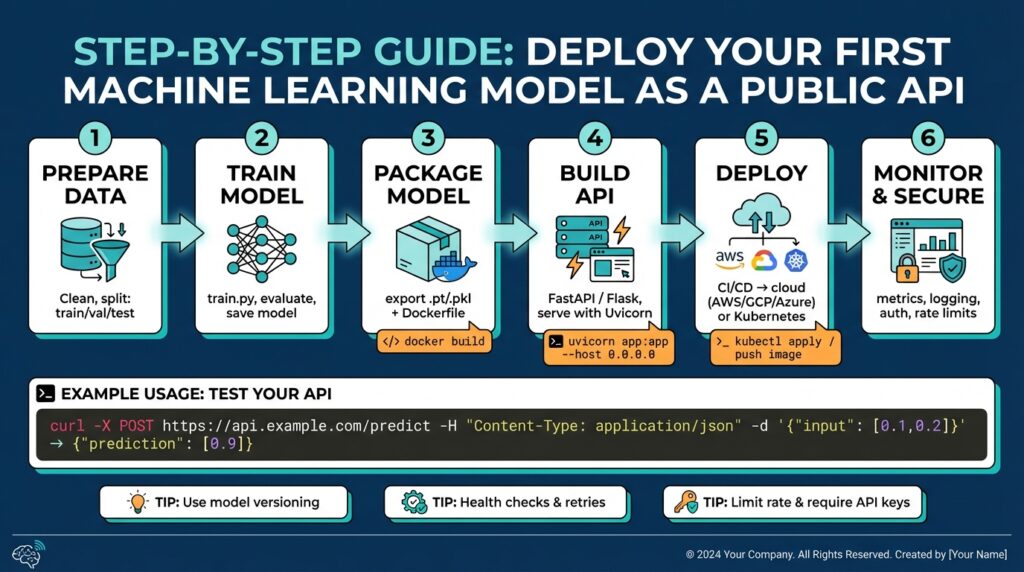
Packaging choices determine how easily you go from artifact to endpoint. For low-latency inference we often place the exported model in a microservice using FastAPI + Uvicorn or a dedicated model server like TorchServe, TensorFlow Serving, ONNX Runtime, or NVIDIA Triton for GPU-optimized throughput. Containerize the runtime with the minimal base image that includes the chosen runtime and pinned dependency versions; include a small bootstrap script that validates the model at startup (load, run sample input, assert output types). If orchestration is part of your stack, add health and readiness probes that check both model load success and a quick end-to-end inference on the sample input.
Finally, validate the exported artifact with automated tests and benchmarking before promoting to production. Build CI steps that export the model, compute checksums, run a set of golden-file regression tests, and run latency/throughput benchmarks under representative hardware. Capture and store the test artifacts and metrics with the export so we can compare releases and do rollbacks confidently. With the artifact, metadata, and CI validations in place, you’ve turned a trained model into a reproducible, deployable asset — next we’ll wire that artifact into a serving runtime and expose the API endpoint for clients to call.
Build API with FastAPI
Building on this foundation, the fastest path from artifact to endpoint is to wrap your exported model in a small, well-typed web service using FastAPI and Uvicorn so clients can call a predictable API for inference. How do you expose a serialized model as a robust, testable API that survives restarts, validation failures, and schema drift? We’ll show concrete patterns for loading the artifact at startup, validating requests with Pydantic, and providing health, readiness, and metadata endpoints that are essential for model serving and automated orchestration.
Start by treating the API contract as part of the model artifact. FastAPI gives you explicit request/response typing via Pydantic models, automatic OpenAPI docs, and async request handling that fits modern inference workloads. We prefer this approach when latency requirements are moderate and you want quick developer feedback; for ultra-high throughput or multi-GPU batching you may still choose a specialized server like Triton or ONNX Runtime server. Use the model manifest you exported earlier to define the Pydantic input schema (shape, dtype, semantics) so your endpoint enforces the same contract used in CI smoke tests and release validations.
Here is a compact, practical pattern you can drop into your repo — a FastAPI app that loads an ONNX artifact at startup and serves a /predict endpoint. The startup event validates the sample input you stored alongside the model, failing fast if loading or inference changes.
from fastapi import FastAPI, HTTPException
from pydantic import BaseModel
import numpy as np
import onnxruntime as ort

class Input(BaseModel):
    features: list[float]

app = FastAPI()

@app.on_event("startup")
async def load_model():
    app.state.session = ort.InferenceSession("/models/latest/model.onnx", providers=["CPUExecutionProvider"])
    sample = np.array([0.0]*app.state.session.get_inputs()[0].shape[1], dtype=np.float32)
    app.state.session.run(None, {app.state.session.get_inputs()[0].name: sample.reshape(1, -1)})

@app.post("/predict")
async def predict(payload: Input):
    arr = np.array(payload.features, dtype=np.float32).reshape(1, -1)
    try:
        out = app.state.session.run(None, {app.state.session.get_inputs()[0].name: arr})
        return {"predictions": out[0].tolist()}
    except Exception as e:
        raise HTTPException(status_code=500, detail=str(e))
In production you must address concurrency, batching, and hardware affinity explicitly. Uvicorn with multiple worker processes scales well for CPU-bound workloads, but if you’re using a GPU-backed runtime avoid naive multi-process spawning since CUDA contexts are process-local; prefer a single process with an internal async batcher or a dedicated serving runtime that manages device pools. Implement a simple request queue or background batching task when model inference benefits from batched inputs; otherwise, keep inference synchronous to reduce tail latency. Always expose /health and /ready endpoints that check both model load state and a lightweight end-to-end inference on the sample input so orchestration tools can make correct placement and routing decisions.
Containerize the service with a minimal pinned base image and include a startup bootstrap that validates the model artifact — fail loudly if checksums or sample outputs differ from the manifest. Run Uvicorn with a command like uvicorn app:app --host 0.0.0.0 --port 8080 --log-level info in your Dockerfile, and consider using Gunicorn with Uvicorn workers (gunicorn -k uvicorn.workers.UvicornWorker) if you need process management features provided by a supervisor. In CI, add a step that mounts the exported model, starts the container in a test network, and runs a suite of golden-file regression calls against /predict and the metadata endpoint so promotion gates validate both contract and numeric stability.
Taking this concept further, instrument the API with request and prediction metadata (input hashes, latency, model version) and stream those to your observability stack so you can detect drift, skew, and performance regressions. With a small, typed FastAPI service, you get fast developer iteration, clear contracts for clients, and a production pathway that integrates cleanly with container orchestration and CI/CD — next we’ll wire these endpoints into automated deployment, routing, and monitoring so serving becomes repeatable and observable.
Define request schema with Pydantic
When a client calls your inference endpoint, the API must fail fast on bad inputs and stay explicit about what it expects — that’s where Pydantic becomes your safety net for the request schema in a FastAPI service. We want the input contract to be machine-checkable, human-readable (in OpenAPI docs), and versioned alongside the model manifest so CI and orchestration can validate compatibility. How do you ensure your API rejects malformed inputs while keeping developer ergonomics? By defining a strict, descriptive model for each inference payload and using validators to enforce shape, dtype, and semantic expectations.
Start by treating the input model as the canonical API contract that mirrors the exported model manifest. Use Field descriptions to document units and normalization (so clients don’t guess), include a model_version field to enable compatibility checks, and mark required versus optional fields explicitly. This keeps the request schema discoverable via the generated OpenAPI docs and makes your endpoint tests deterministic: CI can load the sample input you exported with the artifact and assert the same schema is accepted at runtime.
A compact, practical pattern is to define a Pydantic BaseModel for single-instance inference and a separate wrapper for batched calls. For example:
from pydantic import BaseModel, Field, conlist, validator
from typing import Optional

class PredictRequest(BaseModel):
    model_version: str = Field(..., description="Semantic model version (MAJOR.MINOR.PATCH)")
    features: conlist(float, min_items=1, max_items=1024) = Field(..., description="Normalized feature vector")
    request_id: Optional[str] = Field(None, description="Client-provided id for tracing")

    @validator('features')
    def validate_floats(cls, v):
        if any(x is None for x in v):
            raise ValueError('features must not contain nulls')
        return v
This example front-loads the most important constraints (length, type) and keeps validation logic explicit. In your endpoint you convert features to a numpy array after Pydantic has guaranteed shape and non-null values; that separation reduces runtime surprises and gives clear error messages to clients when requests are invalid.
For more advanced checks — image uploads, base64 payloads, or exact tensor shapes — add field-level or root validators that enforce dtype and shape semantics. If you accept an array field but need a fixed second dimension, validate like: convert to a numpy array in the validator, assert arr.ndim == 1 and arr.shape[0] == expected_dim, and raise a ValueError otherwise. For batched inference, either accept list[PredictRequest] or create a BatchRequest model with a root_validator that transposes and asserts a consistent shape across instances; this lets you implement server-side batching safely without implicit assumptions.
Don’t forget error handling and observability: surface Pydantic validation errors as 400 responses with structured JSON so clients and test harnesses can parse failures automatically. Map validation errors to a consistent error schema (code, field, message) and include request_id when present to make troubleshooting easier. Reuse the same Pydantic models for request parsing, OpenAPI docs, and test fixtures so your golden-file regression tests can exercise the exact contract your deployment expects.
Finally, embed schema checks in your CI and startup validation so the running service refuses to serve a model if its sample input doesn’t validate against the request schema in code. We use the model manifest’s sample input to smoke-test the FastAPI app during container startup and CI gating, and we version the Pydantic models alongside the model artifact so contract drift is explicit. Taking this approach ensures the request schema is not an afterthought but an enforceable part of the deployment pipeline — building directly into the next step where we wire these endpoints into automated deployment and monitoring.
Containerize application with Docker
Building on this foundation, the most reliable way to guarantee portability and consistent runtime behavior is to package the FastAPI service and model runtime into a reproducible container image using Docker. Front-load portability: Docker lets you declare the exact OS libraries, Python runtime, and native binaries the model needs so your service behaves the same in CI, staging, and production. If you plan to use container orchestration, a small, predictable Docker image reduces scheduling friction and speeds up deployment. How do you choose what goes into the image versus what you mount at runtime? We’ll unpack that tradeoff below.
Start with a deterministic Dockerfile that pins every dependency and uses a multi-stage build to minimize runtime surface area. Use a slim official Python base (for example, python:3.11-slim) in the final stage and a builder stage for compiling native extensions; include a lockfile or requirements.txt with pinned versions (and hashes) so CI produces byte-for-byte identical images. In the final stage, copy only the app code, the model manifest (not necessarily the model blob), and the minimal runtime tools; run a startup bootstrap script that verifies the model checksum and sample inference during container start so the container fails fast on corrupted artifacts.
Decide whether to bake the model weights into the image or mount them at runtime based on model size and release cadence. If your artifact is small and versioned per release, baking it into the image produces an immutable, self-contained artifact that simplifies rollbacks and reproducibility; include the model in a dedicated path like /opt/model and set the model version via LABELs. For very large models, prefer mounting from object storage or a read-only volume and implement a fast local cache and checksum verifier in the entrypoint; this keeps the image size manageable and lets you update models without rebuilding the service image. Example CMD you’ll run in the image: CMD ["uvicorn","app:app","--host","0.0.0.0","--port","8080"] so orchestration tools can manage the process.
If you need GPU acceleration, base the image on a CUDA-capable runtime and test with the same driver stack you’ll use in production. Use NVIDIA’s CUDA or cuDNN base images in the builder or final stage and validate the NVIDIA Container Toolkit (or the equivalent runtime) in CI smoke tests; avoid spawning multiple worker processes that each try to initialize CUDA contexts, and prefer a single-process async server or a device manager inside the container. Set CUDA_VISIBLE_DEVICES and expose resource requests in your orchestration spec so scheduling aligns with GPU node capacity; this prevents noisy-neighbor GPU failures and reduces unexpected device allocation errors.
Harden the container with operational best practices that matter for production readiness. Run the service as a non-root user, drop unnecessary capabilities, and minimize the number of layers that contain secrets; inject credentials at runtime using secret mounts or your secrets manager rather than baking them into the image. Expose liveness and readiness endpoints (the readiness check should include a quick sample inference) so orchestration tools can make correct placement decisions, and emit structured logs to stdout/stderr for your observability pipeline so you can trace model version, request_id, latency, and input hashes.
Optimize image size and build performance to keep CI and deployment fast. Use multi-stage builds to compile native dependencies in a builder image and copy only the resulting wheels into the runtime image, run pip install --no-cache-dir and prefer pre-built wheels to avoid compiling during Docker builds, and leverage layer caching by ordering Dockerfile steps from least- to most-frequently changing. Tag images immutably with semantic model+service versions and record the image digest (SHA) in your model manifest so CI/CD can promote exact artifacts across environments without ambiguity.
Finally, integrate image builds into your CI/CD pipeline and map runtime health to orchestration policies so deployments are automated and observable. Push signed images to a registry, run CI smoke tests that start the container, call the /predict and /ready endpoints against the seeded sample input, and publish the test artifacts alongside the manifest. Taking these steps ensures the containerized service is reproducible, secure, and ready for container orchestration; next we’ll wire the container into automated deployment and routing so clients can call a stable, versioned inference endpoint.
Implement security and rate limiting
Building on this foundation, the first line of defense for a public inference endpoint is a layered approach to security and rate limiting that protects model integrity, client data, and cluster capacity. You should front-load transport and identity controls: enforce TLS for all inbound traffic, terminate or proxy certificates at the edge, and refuse plain-text connections inside trusted networks. We’ll treat authentication, authorization, and quota enforcement as orthogonal layers so each can evolve independently and be tested in CI alongside the model manifest and sample inputs you already use.
Authentication and authorization must be explicit and machine-checkable so the API enforces the same contract the model expects. Use strong identity tokens (for example, signed JWTs with a short TTL) or OAuth2 flows for human-initiated clients, and issue long-lived API keys or mTLS certificates for service-to-service calls depending on your trust boundaries. In FastAPI you implement this as a dependency that verifies signatures, checks exp/nbf, and validates a model_version claim; put authorization checks next so you can gate which key/model_version pairs may call which endpoints and reject mismatches early.
Protecting data in motion and at rest complements identity controls and reduces attack surface. Enable TLS with modern cipher suites, enforce HSTS at the gateway, and rotate your TLS keys via automated certificate management; for sensitive workloads add mutual TLS (mTLS) between services to prevent lateral impersonation. Keep secrets out of images by mounting them at runtime from a secrets manager and validate secrets at container startup—fail fast if keys, certificate chains, or token-signing keys don’t match the manifest checksums you store with the model artifact.
How do you choose the right rate-limiting strategy for a public inference API? Start by defining your service-level quotas: per-API-key and per-IP rate limits, a global burst allowance, and separate quotas for heavy operations (batch inference) versus low-cost requests (metadata). For distributed enforcement, implement a token-bucket or sliding-window limiter backed by Redis; token buckets give controlled bursts while sliding windows smooth traffic spikes. Instrument limits with headers (X-RateLimit-Limit, X-RateLimit-Remaining, Retry-After) and return 429 with a clear Retry-After so clients can back off predictably.
Decide where to enforce policy: at the API gateway for centralized control, or in-app for tight coupling with model version and request semantics. Gateways (Envoy, a cloud API gateway, or a managed edge) simplify centralized authentication, IP allowlists, and global rate limiting, while in-app middleware lets you apply model-specific checks (for example, reject large batches for certain model_version values). For example, implement a FastAPI middleware that consults Redis to decrement a token count per API key and logs breaches to your observability pipeline; this pattern keeps orchestration tools informed and lets us rollback or throttle without redeploying the model container.
Treat policy as code and validate it with the same rigor you apply to the model artifact. Add automated tests that simulate auth failures, replay high-concurrency bursts to validate rate limits, and assert the service emits correct headers and metrics. Deploy synthetic load tests in CI that exercise quota policies and alerting rules, and include those results in the model manifest so promotion gates can block releases that exceed capacity budgets. Taking this approach ensures your API security posture and rate limiting are reproducible, testable, and operable as you move the container through staging into production.
Deploy and monitor endpoints
Building on this foundation, the moment you deploy a model-backed API you must treat endpoints as first-class, observable services — not ephemeral test hooks. When you deploy and monitor endpoints, instrument the API and the model together so every request carries context (model_version, request_id, input_hash) and every response emits latency and outcome metrics; this pairing is the foundation for automating safe rollouts and diagnosing production regressions. How do you measure success in the first minutes after deployment, and what exactly should your pipeline compare between a canary and baseline? We’ll show practical patterns you can adopt immediately.
Choose a deployment strategy that matches risk tolerance and rollout speed. A blue-green deployment gives you an atomic switch and a simple rollback, whereas canary releases let you validate key metrics against a baseline progressively; A/B or champion-challenger experiments let you collect comparative business metrics (conversion, revenue, or downstream accuracy) in parallel. Integrate the chosen strategy into your CI/CD so model promotions include immutably tagged images, the manifest checksum, and an automated smoke test that runs the sample input; promote only when smoke tests and early canary metrics meet predefined thresholds.
Autoscaling and resource control are the operational levers that keep endpoints responsive under load. Scale based on meaningful signals: request concurrency and p95 latency for CPU-bound models, GPU utilization or custom inference-in-flight metrics for accelerators, and queue depth for batched servers. Use horizontal autoscalers and pod-level resource requests in orchestration tools, and pin affinity for GPU nodes when needed; configure graceful drain settings so in-flight requests finish and the model persists state during rolling restarts to avoid cold-start spikes.
Observability for inference needs both application and model signals. Emit structured logs that include model_version and request_id, expose Prometheus-style metrics for request_count, request_latency_seconds (histogram with p50/p95/p99 buckets), model_inference_time_seconds, and model_errors_total, and produce traces that connect client requests to downstream feature stores or data preprocessing jobs. Annotate metrics with labels like model_version, deployment_id, and batch_size so you can slice and compare across releases. Below is a compact FastAPI pattern using prometheus_client to get you started:
from prometheus_client import Counter, Histogram, generate_latest
REQUESTS = Counter('inference_requests_total', 'Total inference requests', ['model_version'])
LATENCY = Histogram('inference_latency_seconds', 'Inference latency', ['model_version'])

@app.post('/predict')
async def predict(payload: PredictRequest):
    REQUESTS.labels(model_version=app.state.model_version).inc()
    with LATENCY.labels(model_version=app.state.model_version).time():
        return await run_inference(payload)

@app.get('/metrics')
async def metrics():
    return Response(generate_latest(), media_type='text/plain')
Detecting drift and data-quality issues requires continuous comparison between production inputs and the training distribution. How do you detect model drift in production? Stream feature histograms and sample embeddings to your metrics store, calculate population stability index (PSI) or KL divergence for numeric features, and set alerts when drift exceeds calibrated thresholds. Augment automated tests with periodic shadow runs that score production inputs with both the current and the previous model; large discrepancies in predicted distributions or business KPIs should trigger a rollback candidate or a deeper investigation runbook.
Automate canary analysis and tie rollback actions to objective gates. Define SLOs (error budget, latency p95, and prediction-quality delta vs baseline) and use a small evaluation window (for example 10–15 minutes at low traffic) to compute guardrail metrics; reject or rollback on sustained deviations beyond the SLO. Capture evaluation artifacts (raw requests, golden outputs, metric snapshots) in your artifact store so you can reproduce the canary verdict locally and audit decisions. Create a short, actionable runbook that maps specific metric breaches to remediation: increase instances for resource saturation, shrink batch sizes for latency spikes, or rollback deployment for accuracy regressions.
Finally, operationalize monitoring by closing feedback loops: route anomalous inputs to a review queue, assign automatic tickets when drift alerts fire, and iterate on retraining triggers rather than treating retraining as ad hoc work. By tying deployment, monitoring, and governance into the same CI/CD and observability pipelines you reduce manual toil and make every endpoint release auditable and reversible. Taking these steps prepares your API endpoints for production traffic and hands you practical controls to detect, respond, and evolve the model reliably as usage changes.