Why Data Quality Determines Model Success
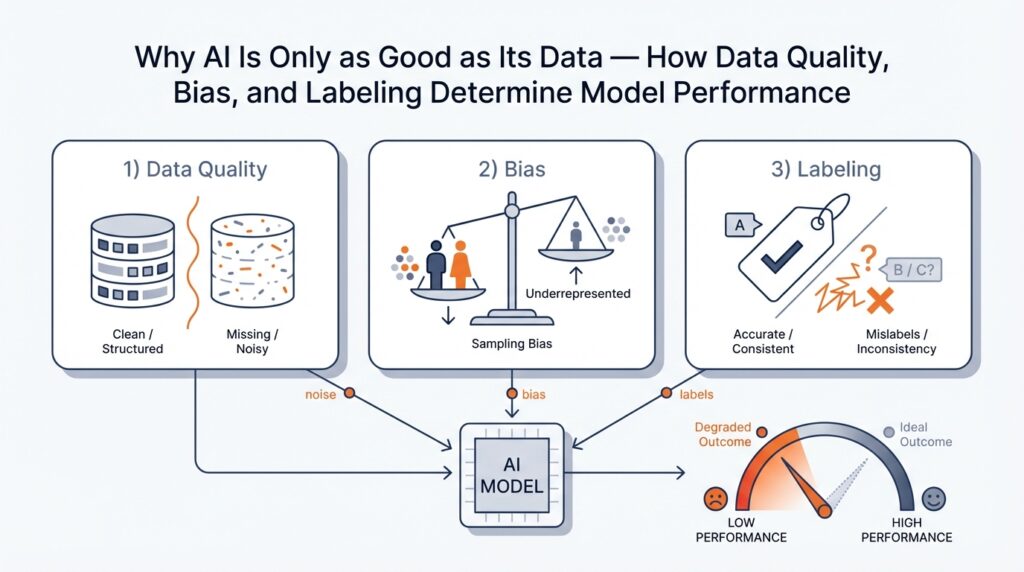
Imagine you’ve just trained a shiny new model and you’re excited to test it — only to find its answers wobble in unexpected ways. Right away we should name the lead actors in this story: data quality and model performance. By data quality I mean the accuracy, completeness, consistency, and relevance of the information we feed a model; by model performance I mean how well the model achieves its goals (accuracy, reliability, and usefulness) on real-world tasks. When those two are mismatched, the model will never live up to your hopes, no matter how clever the algorithm is.
First, let’s understand why the input matters more than the wizardry under the hood. Training data is the set of examples we use to teach a model; think of it like the cookbook for a chef-in-training. If recipes (data points) are wrong, missing steps, or only represent one style of cooking, the chef will make bad meals when asked to perform in the wild. The same holds for machine learning: models learn patterns from examples, so poor dataset quality produces brittle, biased, or simply incorrect behavior in production.
Data quality itself is not a single thing but a family of characteristics that each shape learning. Accuracy means the values in your dataset reflect reality; completeness means you’re not missing entire classes or important features; consistency means formats and units line up; representativeness means the dataset reflects the variety of situations the model will see in production. When any of these fail, you get different symptoms — poor accuracy leads to wrong predictions, missing classes produce blind spots, and lack of representativeness creates surprising failure modes when the real world diverges from your training set.
Labeling — the way we attach ground-truth answers to examples — deserves its own spotlight because models depend on those labels to know what’s right. Labeling (also called annotation) is the human or automated process of assigning the correct output to each input example, like tagging an image as “cat” or “dog.” How do you know if labels are good? We look for high inter-annotator agreement (humans mostly agree), clear labeling guidelines, and periodic audits; weak labeling creates noisy signals that teach the model the wrong lessons, and noisy lessons are hard to unlearn.
Bias enters the story when your data systematically over- or under-represents certain groups or situations. Bias (in data) means the dataset leans in a way that will skew the model’s behavior — for example, a face recognition dataset with mostly one skin tone will cause worse accuracy on others. That kind of skew doesn’t just hurt numbers; it harms trust and can create unfair outcomes. Identifying sampling bias and measurement bias early lets us redesign data collection and rebalance samples before we bake the unfairness into the model.
Quantity often tempts us: more data feels safer. But quantity is no substitute for quality. Think of ingredients for a soup: a large pot of spoiled vegetables won’t taste good just because there’s a lot of it, whereas a modest bowl of fresh produce will. In practice that means prioritizing curated, well-labeled examples, targeted data collection for underrepresented cases, and iterative cleaning over blind accumulation. Small, high-quality datasets used smartly (augmentation, active learning, careful validation) often yield better model performance than huge, noisy corpora.
So how do we measure and protect dataset health? Start by tracking simple metrics — label accuracy, class balance, feature coverage, and drift over time — and automate checks where possible. Data profiling tools and validation splits give you a baseline; audits and adversarial tests poke at weak spots. Most importantly, treat data maintenance as ongoing work: logging new failures, updating labels when requirements change, and re-sampling when distributions shift will keep model performance from degrading silently.
Building on this foundation, the next step is to explore practical ways to fix the problems we just described: strategies for bias mitigation, labeling workflows that scale, and evaluation techniques that catch hidden defects. With those tools, we’ll move from diagnosing why a model fails to actually improving its behavior in repeatable, measurable ways.
Common Data Problems: Missing, Noisy, Biased
Imagine you’ve just deployed a model and its answers wobble in a few predictable places — that wobble often traces back to three everyday villains of data quality: missing data, noisy data, and bias. Right away we’ll name each one and walk through what they feel like in practice: missing data means values or examples are absent; noisy data means values are wrong, inconsistent, or corrupted; bias means your dataset systematically favors some groups or situations over others. How do you spot these problems before they become disasters in production?
Missing data shows up like blank pages in a recipe book: an ingredient is listed as “—” or a price field is empty, and suddenly the whole dish fails. When we encounter missing values, the first thing to ask is whether the absence is random or meaningful — missing at random means the gaps are unrelated to the thing we care about, while missing not at random means the absence itself carries information (for example, people might skip a sensitive survey question for a reason). Practical signals include whole columns with many blanks, entire classes underrepresented, or timestamps that stop abruptly; each pattern points to a different fix, from simple imputation (filling gaps using averages or model predictions) to targeted recollection of data where a gap signals a systemic collection issue.
Noisy data is the kind of mess that teaches your model the wrong habits: typos in text, mislabeled images, duplicate rows, sensor glitches that produce spikes, or inconsistent units like mixing meters and feet. Think of noisy data as static on a radio — the melody (signal) is there, but the noise blurs the tune. We detect noise by looking for odd outliers, low inter-annotator agreement (when humans disagree on labels), or features with absurd distributions. Cleaning strategies range from automated validation rules and deduplication to human-in-the-loop review for ambiguous cases; importantly, labeling noise is especially pernicious because models treat labels as truth, so even a small fraction of wrong labels can skew learning.
Bias in data is the slow-moving trap that turns a technical error into a real-world harm: it produces models that perform well on paper but unfairly on people. Bias can be sampling bias (your dataset overrepresents one group), measurement bias (the way you collect data favors certain outcomes), or label bias (annotators’ assumptions shift labels). A common example is a medical dataset skewed toward one demographic, which leads to worse predictions for others. Spotting bias means probing performance by subgroup, inspecting feature distributions, and asking who was left out of collection and why.
These three problems rarely appear alone; they amplify each other and create failure cascades. Missing examples from a subgroup can look like bias; noisy labels in a small class can make the model ignore that class entirely; bias in sensors causes systematic noise that looks like randomness. Treat them like intertwined threads in a tapestry — pulling one affects the others — which is why diagnostics should be multidimensional: class balance reports, correlation checks, label confusion matrices, and drift monitoring over time.
What can you do right now to start fixing them? Begin with simple, repeatable checks: profile your dataset to find missingness and outliers, run quick agreement tests on a label sample to measure noise, and slice metrics by demographic or feature to uncover bias. For repairs, use imputation and reconstruction for innocuous gaps, use rule-based cleaning and spot audits for noisy records, and rebalance or augment underrepresented groups to mitigate bias while documenting assumptions. Where labels are suspect, incorporate a small human review loop and prioritize relabeling the examples that confuse the model most.
As we move forward, remember that data quality, bias, and labeling are not one-off tasks but ongoing practices; catching issues early saves retraining cycles and reputations. With these diagnostics and a habit of asking “who’s missing from this dataset?” and “what might be distorted here?” we turn reactive debugging into thoughtful data stewardship — and that’s the next place we’ll explore.
Labeling Quality: Noise, Disagreement, Guidelines
Imagine you’ve reached the part of the project where the model is almost ready, but its behavior is jittery — and when you look closer the trouble keeps pointing back to labeling quality, label noise, and how instructions were written. Right away we should name the players: labeling quality (the reliability and clarity of the answers your annotators provide), label noise (incorrect or inconsistent labels that act like static in training), and annotation guidelines (the written rules that steer every human decision). Framing those three together helps you stop guessing and start fixing the root cause of unpredictable model behavior.
Label noise is the most common practical villain you’ll meet, and it comes in flavors. Sometimes labels are wrong because a worker made a mistake; sometimes the task itself admits multiple reasonable answers and different annotators choose different ones; other times the data is ambiguous and the label truly depends on context that wasn’t provided. Inter-annotator agreement is the bellwether for these problems — it measures how often humans agree — and low agreement tells you whether the issue is human error, ambiguous examples, or a missing rule in your guideline.
Before changing models, measure the disagreement with clear, simple metrics so you know what to fix. Inter-annotator agreement (the idea that multiple people should reach the same label for the same example) can be estimated with majority vote rates, percent agreement, or agreement statistics like Cohen’s kappa and Krippendorff’s alpha; these names sound technical, but they all answer one plain question: do people see the same thing? If agreement is high, noisy labels are likely random mistakes; if agreement is low, your annotation guidelines or the task design are probably the culprits. Knowing which case you’re in points to very different remedies.
Good annotation guidelines are like a well-written recipe: they reduce guesswork and keep the dish consistent across cooks. A practical guideline includes a clear definition of the target label, concrete positive and negative examples, edge cases with explicit decisions, and a short decision tree for ambiguous inputs. We’ve found it useful to include “why” notes that explain the reasoning behind tricky rules, because that helps annotators apply judgment consistently instead of inventing ad hoc policies. Update the guidelines after audits — treat them as living documents rather than a finished manual.
Turn guidelines into a healthy workflow so labeling quality scales. Start annotators with a training set and calibration session where you review disagreements as a group; require annotators to flag uncertain examples rather than guess; use a small gold set (examples with trusted labels) to monitor ongoing quality; and introduce an adjudication step where a senior reviewer resolves persistent disagreement. For ambiguous cases, consider probabilistic or soft labels that capture uncertainty instead of forcing a single answer — models can learn from label confidence and that reduces the damage of borderline examples.
When label noise still creeps in, there are practical remediation tactics you can apply without throwing away your dataset. Re-label the examples with the highest disagreement or those the model finds most confusing; prune clearly incorrect labels; and prioritize relabeling for small but important classes that suffer most from noise. On the modeling side, techniques like label smoothing, robust loss functions, or training on consensus-weighted labels help the model be less brittle to remaining noise, but those are complements — not substitutes — for solid annotation work.
To make this concrete, imagine you’re labeling sentiment for product reviews and annotators split on sentences like “I wanted to love it, but…” Without a guideline, half mark it positive and half negative. A targeted guideline that defines whether the final sentiment or the initial intent wins, combined with a short adjudication set, will turn that uncertainty into consistent labels and immediately reduce label noise. The same approach — guidelines, calibration, gold tests, and focused relabeling — works across tasks from image bounding boxes to medical code assignment.
Building on this foundation, the central idea to carry forward is this: invest time in writing crisp annotation guidelines and a clear reviewer workflow early, and measure inter-annotator agreement often. That investment pays off by turning noisy disagreements into structured knowledge you can fix, which gives your model a steady diet of reliable labels and makes downstream bias-mitigation and scaling strategies far more effective.
How Bias Enters Datasets And Models
Imagine you’re preparing a potluck and you ask everyone to bring a dish, but half the guests only bring desserts. The feast will look unbalanced and people expecting savory food will be disappointed. The same thing happens with data: when the inputs are skewed, the result is data bias, dataset bias, and ultimately model bias that surprises you in production. How does this sneak in, and what are the everyday places we miss it? Asking that question now helps you catch bias early and protect the data quality you’ve been working to build.
The most obvious doorway for bias is sampling — the who and where of collection. If you collect images from one city, interviews from one platform, or logs only from power users, your dataset will overrepresent those situations. Sampling bias feels like meeting only one flavor of people: your model learns habits common to that group and treats them as universal. A concrete example is a facial recognition corpus drawn mostly from a single region, which trains a system that performs poorly on faces from other regions. Recognizing sampling bias means asking, “Who wasn’t invited to this data potluck?” and then deliberately widening the guest list.
Another common path is measurement bias — the way features are captured or labeled tilts results. Sensors that drift, surveys phrased in leading ways, or inconsistent units create systematic errors that push the model toward wrong conclusions. Think of a thermometer that reads high in hot weather: every prediction that depends on temperature will be off. Measurement bias often hides in preprocessing: converting currencies without noting locales, normalizing timestamps without preserving time zones, or compressing images differently across sources. These small choices can add up into substantial bias in datasets.
Labeling decisions are their own storytelling moment where human judgments shape outcomes. When annotators bring their assumptions to ambiguous data, label bias occurs: what one person tags as “spam” another calls “opinion.” How does bias slip in during labeling? It happens through vague guidelines, cultural assumptions, and inconsistent adjudication. Because models treat labels as ground truth, label bias becomes a direct teacher of unfair patterns. That’s why clear instructions and representative annotator pools matter — they’re the editors that make the narrative consistent.
Historical and proxy biases are subtler but powerful. If you train a hiring model on past hiring decisions, you teach it historical preferences — including past discrimination — even if the model never sees demographic fields. Proxy variables (like zip code or education type) can stand in for protected traits and recreate inequities. This is like following an old recipe that calls for “the usual guest” — it will keep reproducing past tastes unless you consciously change the ingredients. Recognizing proxies and questioning historical data are ways to prevent perpetuating unfairness.
Models don’t just inherit bias; they can amplify it. When a model optimizes for overall accuracy on an imbalanced dataset, it may favor the majority class and ignore minorities because that yields a lower loss. Once deployed, predictions influence user behavior and data collection, forming a feedback loop: biased recommendations get clicked more, which generates more biased data, which reinforces the same model bias. Evaluation bias compounds the problem when your test set mirrors training skew: you’ll think performance is great while real-world fairness suffers.
Technical steps in the pipeline — imputation, deduplication, feature engineering, and threshold selection — are quiet places where bias can creep in. Filling missing values with a mean can erase meaningful subgroup differences; removing outliers without checking who they represent can silence marginalized cases; standardizing features without reflecting different measurement contexts can disadvantage certain groups. Each preprocessing decision is a fork in the story and should be made with awareness of who it helps or harms.
Building on the earlier discussion of data quality and labeling, the practical takeaways are simple: map the collection pathway, inspect for missing groups, audit labels for systematic skew, and test models across subgroups rather than only on aggregate metrics. We’ve now traced the main routes by which bias enters datasets and models, which sets the stage for concrete strategies you can apply next to reduce harm and improve fairness.
Detecting Drift, Leakage, And Data Issues
Imagine you’ve just put a model into production and a few weeks later its answers start to wander — some days it hums, other days it trips over the same cases. Right away we meet three practical problems that spoil performance: data drift, data leakage, and everyday dataset issues. Data drift (when the statistical patterns your model learned change over time), data leakage (when training sees information it shouldn’t have at prediction time), and dataset issues (missing values, noise, imbalance) are the invisible gremlins that nibble at accuracy, trust, and fairness. Building on the foundation we covered earlier about label quality and bias, this is where monitoring and detective work keep your model honest.
First, let’s meet drift as a character in the story. Data drift is the slow or sudden change in input distributions — imagine the world swapping one ingredient for another in your recipe book; the model expects flour but starts seeing cornmeal. Concept drift (when the relationship between inputs and the target changes) is a close cousin: the same features mean something different than before. We detect drift by watching the distributions of key features and target behavior over time and treating those changes as signals, not noise.
So how do you spot drift in practice? Start with simple, repeatable checks: track summary statistics (means, variances), monitor histograms and percentile shifts, and compute divergence scores like population stability index (PSI) or Kullback–Leibler divergence (a way to measure how one distribution differs from another). Shadow models or baseline predictors that run alongside production can show degrading performance before end-user metrics do. Drift monitoring that alerts on significant distributional changes gives you time to investigate whether the world changed or your data pipeline broke.
Next, let’s unmask leakage — the sneaky cheat sheet your model shouldn’t have. Data leakage happens when some training features contain information that will not be available at prediction time, or when labels leak into features through preprocessing. A classic example is including a “time of discharge” field when predicting length of hospital stay: that timestamp exists only after the event and inflates training accuracy. Label leakage makes models look great in validation but collapse in the real world because they learned to read answers instead of learning the underlying patterns.
How do you catch leakage before it ruins your metrics? Ask the temporal question: would this feature be available at prediction time? Enforce temporal splits during validation (train on older data, test on newer data) and run feature-importance checks to see if a handful of variables explain nearly all predictive power. Conduct feature ablation tests — remove suspicious features and see whether performance drops unnaturally — and keep a tight data lineage log so every transformation can be traced back to its source. These steps help you find and remove the “answers” that shouldn’t have been given to the model.
Other dataset issues are often folded into the same investigation. Missing values, noisy sensors, duplicated rows, label errors, and severe class imbalance all amplify the harm of drift and leakage by hiding real problems in aggregate metrics. Data profiling tools and periodic label audits uncover gaps: a sudden rise in missingness for a particular feature can be the first sign of a broken integration, while a spike in label disagreement often points to guideline drift or a new edge case in the wild. Treat these as lead indicators that deserve quick triage, not just notes in a ticket queue.
When you find a problem, have a small, practical playbook ready. If drift is benign and temporary, consider recalibrating thresholds or using incremental learning; if drift reflects a systematic shift, collect fresh labeled examples and retrain. On leakage, revert to a safe model snapshot, run a feature audit, and rebuild validation with time-aware splits. Across all issues, automate alerts, keep a canary deployment for new models, and document every change so you can trace cause and effect. With that discipline, detecting drift, preventing leakage, and fixing dataset issues become routine parts of maintaining model health — the next step is learning how to correct those problems at scale while preserving fairness and label integrity.
Practical Fixes: Cleanup, Augmentation, Curation
Building on this foundation, the first thing we want to do together is put data quality front and center — because practical fixes begin with knowing what’s actually wrong. Imagine you’re proofreading a cookbook before a dinner party: some recipes miss steps, some use different measuring cups, and a few are outright mislabeled. In the world of machine learning, that’s data cleaning: the deliberate work of fixing missing values, removing duplicates, and making formats consistent so the model learns from a reliable set of examples.
Data cleaning (sometimes called cleanup) is the straightforward but unspectacular hero of model reliability. By cleanup we mean actions like imputation — filling missing values using sensible guesses such as averages or model-based predictions — deduplication to avoid overweighting repeated examples, unit harmonization so meters don’t silently mix with feet, and targeted relabeling when annotations are incorrect. Think of these steps as standardizing the recipe measurements so every cook follows the same instructions; without them, the model will learn inconsistent rules and perform unpredictably.
So what does a practical cleanup routine look like in your project? Start by profiling the dataset: compute missingness ratios, look at feature histograms, and inspect the most common label confusions. Automate simple validation rules (email-format checks, range checks for numeric fields, regex for product IDs) to catch obvious errors early, and create a small gold set — a handful of carefully curated examples with trusted labels — to measure whether fixes actually improve label quality. We’ll also flag the highest-impact problems: relabel examples that the model misclassifies most often, because those are the ones teaching it wrong lessons.
Once cleanup steadies the foundation, data augmentation becomes a powerful way to teach the model about variety. Data augmentation means generating additional training examples by transforming existing ones: in images that could be rotations and color jitter; in text it might be paraphrasing or back-translation (rewriting a sentence through another language and back to create a natural variant); in tabular data techniques like SMOTE synthesize minority-class examples. Augmentation helps with class imbalance and robustness, but we must be careful: naive augmentation can amplify bias if we synthetically overrepresent a subgroup or create unrealistic examples, so always validate augmented samples with human review.
Curation — the act of selecting and organizing examples — is about focus and intent. Good curation means prioritizing which data to label or relabel first, grouping edge cases for adjudication, and keeping an auditable dataset history so you can explain why a model behaves a certain way. How do you decide what to relabel first? Use error analysis: pick the examples where the model is most uncertain or where performance drops for a specific subgroup, then put those into a small, fast human-in-the-loop labeling cycle. Active learning (where the model asks for labels on uncertain examples) and uncertainty sampling are practical strategies to make each label purchase count.
Turn these ideas into a repeatable workflow so fixes aren’t one-off chores. Measure → prioritize → fix → validate → monitor is a simple loop we use: measure problems with profiling and subgroup tests, prioritize fixes that address the largest error or fairness gaps, apply cleanup and augmentation, validate improvements on a held-out set that mirrors production, and monitor for drift afterwards. Keep versioned datasets, log lineage for every transformation, and maintain concise annotation guidelines so future reviewers see the same decision path.
To make this concrete, imagine a sentiment dataset for product reviews: first clean messy text and consistent rating scales, then augment the minority class with paraphrases to reduce imbalance, curate a gold set of ambiguous reviews for adjudication, and use active learning to relabel examples your model finds confusing. That sequence of cleanup, augmentation, and curation turns vague, noisy data into a structured training set that improves both accuracy and fairness.
Building on what we’ve done so far, these practical fixes turn diagnosis into action: you’ll reduce label noise, expand meaningful variety, and keep the dataset honest over time. Next we’ll look at techniques to detect and prevent bias amplification so the improvements you make stay fair in production.