Define Integrity Requirements and Metrics
Nothing breaks trust faster than invisible corruption in your transforms—so the first engineering step is to turn abstract promises about quality into concrete, testable requirements. Building on this foundation, we must define data integrity requirements up front and translate them into measurable integrity metrics that run inside your ETL and monitoring stack. When you write requirements, front-load the business impact: what downstream analytics or SLAs depend on this dataset? Asking that question forces you to pick the right metrics for your data pipeline and avoid chasing noisy signals.
Start by categorizing integrity expectations into a small set of domains: completeness, accuracy, consistency, timeliness, uniqueness, validity, and lineage. Completeness measures whether all expected records arrived and were transformed; accuracy captures field-level correctness against authoritative sources; consistency tracks cross-table and cross-batch referential rules; timeliness quantifies latency or SLA violations; uniqueness detects duplicates; validity verifies schema and value constraints; lineage ensures traceability from source to consumer. Define each requirement as a sentence tied to business impact, for example: “99.9% of payment events must be present in the analytics table within 15 minutes of source arrival.”
Translate those domains into specific integrity metrics you can instrument. For completeness use a reconciliation ratio (ingested_count / source_count) and a missing-record rate; for accuracy track field error rate and value drift against a certified source; for timeliness monitor p50/p95/p99 ingestion latency and SLA breach percentage; for uniqueness compute duplicate rate and deduplication success; for validity measure schema conformance rate and null-rate per column; for lineage measure percent of records traceable to a source system ID. Set realistic thresholds with business stakeholders—how strict must accuracy be to trust a report?—and express targets as SLOs and alert thresholds, for example accuracy >= 99.5% or reconciliation ratio >= 0.999.
Instrument metrics where the work happens: inside extractors, during transform jobs, and at load-time validation. Use lightweight, deterministic checks such as row counts, hash totals, and field-level checksums to detect silent corruption quickly, and augment these with periodic sample-based deep validations that compare payloads or aggregates to the source. For streaming pipelines emit latency and completeness metrics per partition and window; for batch pipelines run pre- and post-load reconciliation and store historical baselines to detect drift. Make metrics machine-readable (numeric counters, histograms, boolean gates) so they feed dashboards, alerts, and automated runbooks without manual interpretation.
Operationalize both measurement and response: assign metric owners, map SLOs to alert severities, and define automated remediation where possible. For example, if reconciliation_ratio drops below target, immediately halt downstream aggregation jobs, create a ticket with the failing batch ID, and trigger a backfill job if the data can be regenerated. Maintain error budgets to tolerate transient failures while escalating chronic issues to engineering. Contract-test transformations in CI using synthetic fixtures and include integrity metric assertions so regressions are caught before deployment.
Finally, think in terms of continuous validation rather than one-off checks. Integrity metrics should be part of your feedback loop: use them to prioritize fixes, tune pipeline SLAs, and evolve schema contracts. Taking this approach lets us detect silent failures earlier, reduce blast radius when transformations change, and provide actionable, measurable guarantees to downstream teams. Next, we’ll use these defined metrics to design monitoring dashboards and automated alerting that enforce the SLOs in production.
Profile and Assess Source Data
Unknown quirks in incoming feeds are the fastest way to erode trust in a data pipeline, so our first engineering move is to surface what the source actually looks like before any transform runs. Data profiling of source data gives you that early visibility: schema shape, cardinality, null-rate, value distributions, and timestamp behavior reveal the kinds of integrity failures that will later cause alerts or silent corruption. By front-loading profiling into extraction, you reduce the blast radius of downstream bugs and make SLO-driven integrity work practical rather than speculative.
Building on the integrity metrics we defined earlier, profiling converts abstract requirements into concrete checks you can run immediately on arrival. Where you defined completeness, validity, and uniqueness as SLOs, profiling tells you the baseline counts, constraint violations, and duplicate patterns to compare against those SLOs. This matters because a reconciliation ratio or field-level accuracy target is only actionable if you know expected cardinalities, common null patterns, and canonical value sets for the source system.
Start with a small set of deterministic checks that are cheap to compute in the extractor: row counts, distinct-key counts, null rates per column, and checksum/hash totals for payload batches. For example, use simple SQL queries during sampling to compute null-rate and distinct keys and a rolling checksum:
SELECT
  count(*) AS total_rows,
  SUM(CASE WHEN important_field IS NULL THEN 1 ELSE 0 END) * 1.0 / count(*) AS null_rate,
  COUNT(DISTINCT pk) AS distinct_pks,
  MD5(string_agg(concat_ws('|', pk, important_field), '||')) AS batch_checksum
FROM source_table
WHERE ingestion_time BETWEEN '{{window_start}}' AND '{{window_end}}';
These lightweight aggregates let you detect schema drift, unexpected cardinality changes, and silent truncation quickly without full payload comparisons.
How do you decide which profiling checks to run first? Prioritize checks that map directly to high-impact SLOs: if timeliness matters, measure timestamp monotonicity and arrival latency; if accuracy matters, verify referential coverage and value-set conformance for critical fields; if billing or payments are involved, validate hash totals and transaction counts immediately. Use stratified sampling for large tables (partition by customer_id or region) so you surface systemic issues that affect only a subset of traffic rather than drowning in aggregate averages.
Profile outputs should feed both automated gates and deeper, periodic analyses. Embed the quick checks in extractors and CI so you fail fast on schema mismatches or checksum divergence, and schedule heavier profiling jobs that compute histograms, percentiles, and drift metrics daily or per batch. Emit these measures as numeric metrics (counters, histograms) to your observability stack so you can correlate source anomalies with downstream job failures and SLA breaches.
Profiling without action is noise; map common fingerprints to remediation playbooks. When a null-rate for a billing_field exceeds threshold, automatically mark batches red, halt downstream aggregations, and trigger a backfill job if the source supports replay. When a distinct_pk count drops unexpectedly, create an incident with the failing window ID and an attachment showing the batch_checksum and sample rows. Tightly coupling profiling alerts to automated runbooks reduces mean time to detect and remediate while preserving error budgets for transient source instability.
Finally, convert profiling artifacts into living baselines that feed dashboards and alert thresholds so we can detect drift instead of repeatedly rediscovering the same anomalies. Profile snapshots, histograms, and sample payloads become the bridge between the integrity metrics we defined earlier and the monitoring and alerting rules you’ll build next, enabling targeted, automated responses to real-world source-data failures.
Run Pre-Transformation Validation Checks
Data integrity is won or lost before your heavy transforms run, so we treat pre-transformation validation as our first line of defense in any ETL workflow. Run lightweight, deterministic validation checks as soon as data is extracted so you catch schema drift, silent truncation, and referential holes before downstream aggregation jobs consume bad inputs. Building on the profiling and integrity metrics we’ve defined earlier, these checks act as gates that map directly to our SLOs (completeness, validity, uniqueness, timeliness), turning monitoring intent into operational decision points you can automate and measure.
At its core, pre-transformation validation combines schema validation, payload sanity checks, and quick-statistics verification. Schema validation verifies column presence, types, and nullability against a contract; payload sanity checks include checksums/hash totals, field-level bounds, and timestamp monotonicity; quick-statistics verification computes row counts, distinct-key counts, and null-rate for critical fields. Define each check with a pass/fail gate and an associated severity—warning, fail-and-halt, or degrade-and-continue—so your pipeline executes a predictable response when a check breaches its threshold.
In practice, prefer cheap, deterministic checks that run inside the extractor or at the ingestion edge. For example, run a per-batch checksum plus a small set of aggregations to detect silent data loss:
SELECT count(*) AS total_rows,
       COUNT(DISTINCT pk) AS distinct_pks,
       SUM(CASE WHEN amount IS NULL THEN 1 ELSE 0 END) * 1.0 / count(*) AS null_rate,
       MD5(string_agg(concat_ws('|', pk, amount, created_at), '||')) AS batch_checksum
FROM source_table
WHERE ingestion_window = '{{window}}';
Emit those numbers as numeric metrics (counters, histograms) and evaluate them against baselines from profiling. In code-driven extractors you can gate with an if-statement: if checksum mismatch OR null_rate > threshold then mark batch_failed, push to quarantine, and trigger a replayable backfill job. That pattern lets you fail fast without requiring full payload comparisons while preserving the ability to repair and resume.
Consider a concrete scenario: a payments feed where downstream reconciliation SLO is 99.9% completeness within 15 minutes. If a pre-transform validation shows a sudden drop in distinct_pks and a changed batch_checksum, we treat that as a high-severity incident. We halt downstream aggregations for that partition, create an incident with the failing window ID and a sample payload, and trigger an automated replay if the source supports retention. Framing checks this way—thresholds tied to business SLOs and automated remediation paths—keeps blast radius small and reduces manual triage.
How do you fail fast without blocking useful work? Use graded responses and feature flags: block only when checks indicate irrecoverable corruption (checksum mismatch, missing PKs), degrade when non-critical fields exceed null-rate thresholds, and quarantine suspicious partitions for targeted reprocessing. Integrate these checks into CI so transformation changes are contract-tested against synthetic fixtures, and instrument streaming extractors to run the same gates per partition/window. That consistency between batch and streaming prevents subtle mismatches when jobs scale or when schema evolves.
Taking pre-transformation validation seriously transforms profiling and metrics into operational safety rails rather than post-mortem artifacts. By mapping each validation to a remediation playbook, emitting machine-readable metrics, and running gates in extractors and CI, we reduce silent failures, shorten mean time to detection, and keep downstream consumers confident in our ETL outputs. Next, we’ll use these validation metrics to build alerting and dashboards that enforce SLOs in production and automate corrective workflows.
Design Idempotent, Auditable Transformations
When a downstream report, SLA, or billing job must be reproducible and repairable, the transformations that feed it need to be both idempotent and auditable up front. Using terms familiar from our earlier sections, idempotent and auditable transformations are two engineering guarantees that protect your data pipeline and preserve trust for consumers. Front-load those guarantees in design: make each transform repeatable without side-effects and instrument every change so you can both verify and reconstruct results. This reduces blast radius for failures and makes automated remediation practical rather than risky.
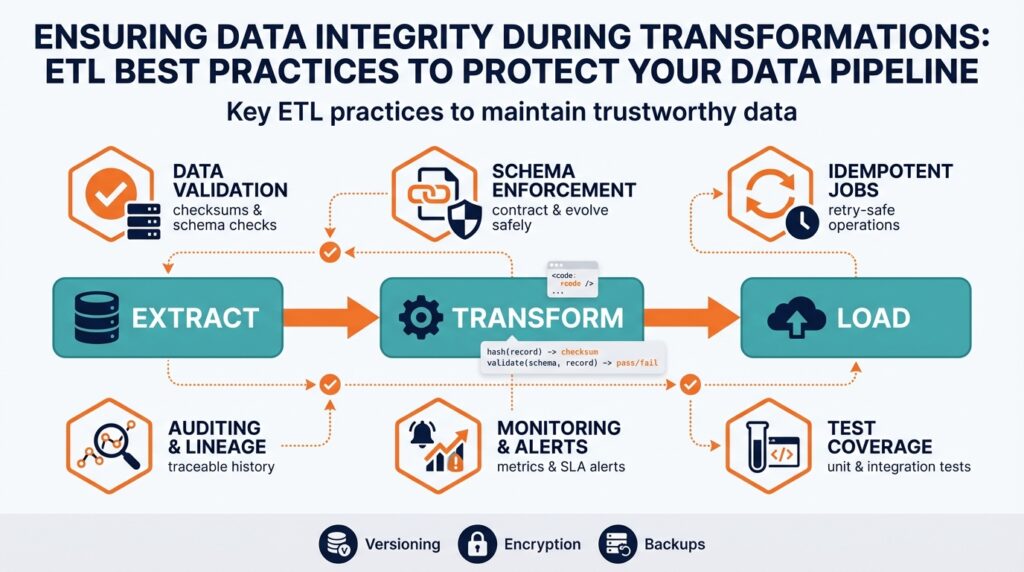
Idempotency means a transformation produces the same final state whether it runs once or ten times with the same inputs. Achieve this by making operations deterministic, identifying stable primary keys, and avoiding append-only side effects without deduplication. In practice we implement deterministic hashes, idempotency keys, and upsert/merge semantics so retries converge instead of duplicating. For streaming jobs, design checkpoints and windowing so replayed events reapply cleanly; for batch jobs, key by canonical IDs and use atomic MERGE semantics to ensure repeatable outcomes.
Auditable means every change is traceable, versioned, and queryable for forensic analysis. To be auditable, a transform must emit metadata about inputs, the code or SQL version that ran, checksums of payloads, and a persistent mapping from source record to result record (lineage). We store transform metadata alongside outputs: transform_id, source_batch_id, input_checksum, output_checksum, transform_version, and execution_timestamp. That set of fields lets you verify integrity programmatically and answer questions like which transform produced an unexpected aggregate or when a migration changed a calculation.
There are concrete patterns you can adopt immediately. Implement atomic upserts keyed by canonical IDs and a transform_version to prevent stale writes. Use a small audit table or object-store sidecar that records batch-level and record-level checksums and a pointer to a sample payload for each failing window. Example MERGE pattern:
MERGE INTO analytics.table AS t
USING (SELECT *, '{{transform_version}}' AS tv FROM staging.batch) AS s
ON t.pk = s.pk
WHEN MATCHED AND s.tv >= t.transform_version THEN
  UPDATE SET ... , transform_version = s.tv, updated_at = current_timestamp
WHEN NOT MATCHED THEN
  INSERT (..., transform_version, created_at) VALUES (..., s.tv, current_timestamp);
This enforces deterministic conflict resolution and records the transformation version that produced each row.
Schema evolution and transformation versioning are core to keeping audits useful over time. Treat transform logic as a service contract: version transforms semantically (major/minor), run contract tests in CI against synthetic fixtures, and tag outputs with the transform_version used. When you change logic, run backfills under the new version but keep the previous outputs available or tagged so lineage queries can resolve which version a consumer relied on. For large tables prefer storing deltas or compressed change-sets and a small sample payload per batch rather than full-row snapshots to balance storage and forensic value.
Operationalize detection and investigation: emit idempotency and audit metrics (checksum_mismatch_count, replays_applied, transform_duration, transform_version_distribution) and wire them into dashboards and alerts. How do you balance audit granularity with storage and latency costs? Typically, use a tiered approach: full record snapshots for high-value flows (billing, payments), compressed deltas for medium-risk datasets, and aggregated checksums for low-risk telemetry. Retention policies should reflect business needs and legal requirements; ensure audit artifacts are immutable and accessible to automated runbooks so remediation can be driven by tooling rather than manual triage.
Taking these practices together transforms your ETL from a black box into a reproducible, debuggable system: retries are safe, rewind-and-replay is feasible, and every stakeholder can trace results back to source records and transform versions. Building idempotency and auditability into the pipeline design gives us the confidence to automate backfills, enforce SLOs, and evolve transforms with minimal customer impact. Next, we’ll show how to surface these audit metrics in dashboards and alerting so the SLOs we defined earlier are enforced in production.
Implement Reconciliation and Checksums
Building on this foundation of integrity metrics, the fastest way to detect and repair silent corruption is to pair deterministic reconciliation with lightweight checksums at every handoff in your ETL. Reconciliation and checksums should be front-and-center in your observability model: they give you numeric, actionable signals for completeness, uniqueness, and accuracy. How do you turn those signals into operational guarantees that protect downstream SLAs? We start by defining what to compare, how often, and what a tolerated delta looks like in SLO language so reconciliation checks become enforceable, not just advisory.
A practical reconciliation strategy reconciles at multiple levels: batch-level row counts and payload checksums, partition- or shard-level aggregates, and field-level hashes for critical columns. The topic sentence: do not rely on a single number. Comparing only total row counts hides fooled aggregates; comparing only checksums misses partial-field corruption. Combine a reconciliation_ratio (target_rows / source_rows) with a payload_checksum and a set of column_checksums for high-value fields. This layered approach maps directly to the completeness and accuracy metrics we defined earlier and gives you graded detection fidelity without expensive byte-for-byte comparisons.
Implement the patterns where the work happens: in extractors, at transform commit, and at load-time validation. For example, compute a stable canonicalization of each record and a batch checksum in SQL or code, then persist both source and target aggregates so you can compute reconciliation_ratio and checksum_match in seconds. Example SQL for a canonical payload checksum:
SELECT
  count(*) AS src_rows,
  md5(string_agg(concat_ws('|', pk, COALESCE(normalize_json(payload), '')), '||' ORDER BY pk)) AS src_checksum
FROM source_table
WHERE ingestion_window = '{{window}}';
Then compare src_checksum to target_checksum and compute reconciliation_ratio = target_rows::float / src_rows. Persist these values alongside window IDs and transform_version so we can query mismatches later.
When a mismatch appears, treat it as an incident with a defined remediation flow rather than a vague anomaly. If checksum_match = false and reconciliation_ratio < SLO, quarantine the affected window, halt downstream aggregations for that partition, create an automated ticket with the failing window_id and sample payload, and trigger a replay/backfill job if the source supports replay. If only a single field checksum diverges and business impact is low, create a degraded path: flag affected rows for review and continue non-blocking downstream work. That graded response prevents unnecessary global stops while keeping blast radius minimal.
Be explicit about checksum semantics and trade-offs up front: canonicalize records (canonical field order, consistent null handling, trimmed strings), choose a hash function with acceptable collision risk for your data volume (MD5 is cheap but weaker; SHA-256 reduces collision risk at higher CPU cost), and salt or include transform_version when you need checksum scope isolation. Also schedule frequency: compute light-weight checksums every ingest window and run deep payload diffs asynchronously for high-risk flows. Store historical reconciliation results to detect drift and to feed anomaly detection models rather than relying on single-window alerts.
Operationalize reconciliation and checksums into your monitoring and runbooks so detection triggers deterministic actions. Emit reconciliation_ratio, checksum_match boolean, and per-field error counts as machine-readable metrics; wire them to alerting with SLO tiers and automated remediation playbooks; and expose a reconciliation dashboard that lets you pivot from a failing metric to the offending window, sample rows, and transform_version. Taking this concept further, integrate these artifacts with your idempotent transformation and audit patterns so replays are safe and forensics are quick—next we’ll show how to surface these audit metrics in dashboards and automated alerting to close the loop on ETL data integrity.
Monitor, Alert, and Audit Continuously
Detecting and containing corruption requires running monitoring, alerting, and audit as continuous production services rather than occasional postmortems—data integrity and ETL reliability depend on it. Right away you should instrument the extract-transform-load surface with machine-readable metrics (counters, histograms, boolean gates) so anomalies show up in seconds, not days. Build on the integrity metrics we defined earlier—reconciliation_ratio, checksum_match, null_rate, and transform_version distribution—and emit them from extractors, transformers, and load commits so every handoff is observable.
Building on those metrics, make monitoring holistic: pair aggregate metrics with sample payloads, lineage pointers, and execution traces so alerts carry context that speeds remediation. When a reconciliation_ratio drifts, the monitoring event should include window_id, source_checksum, target_checksum, transform_version, and a short sample of failing rows so an engineer can decide whether to backfill or degrade. We want telemetry that answers the first five questions an on-call engineer will ask: what failed, where, when, which version authored the output, and how to reproduce the payload.
Design alerts as SLO-driven operators rather than noise generators. Start by mapping SLO tiers to alert severities—warning, page, and silent log—and implement deduplication, grouping, and mute rules to avoid paging on transient flaps. For example, a high-severity page triggers when reconciliation_ratio < 0.999 AND checksum_match = false for two consecutive windows; a warning triggers on a single-window deviation or when only a noncritical field checksum diverges. A compact alert rule looks like this:
alert: HighReconciliationFailure
expr: reconciliation_ratio{dataset="payments"} < 0.999 and checksum_match == 0
for: 2m
severity: page
annotations:
  runbook: "playbooks/payments/reconciliation.md"
  sample_window: "{{window_id}}"
Maintain immutable audit artifacts so every alert can be investigated without re-ingesting massive payloads. Record batch-level metadata (source_batch_id, input_checksum, output_checksum, transform_version, execution_timestamp) and keep a small sample payload or compressed delta for every quarantined window. Store these artifacts in an append-only audit table or an object-store sidecar that your runbooks can query; this gives you the forensic ability to answer which transform produced an incorrect aggregate and to run deterministic replays.
Automate remediation paths where possible so alerts trigger deterministic actions instead of ad-hoc firefighting. For instance, an automated runbook can quarantine the affected partition, halt dependent aggregation jobs, open a ticket populated with metadata and sample rows, and start a replay/backfill job if the source retains data. Use idempotent backfill jobs and transform_version tagging so replays converge; capturing transform_version in both alerts and audit records prevents applying the wrong logic when multiple code versions exist in flight.
How do you keep alerts actionable for busy on-call teams? Tune thresholds with error budgets, correlate metric spikes with recent deploys or schema migrations, and require alerts to include remediation steps or a direct runbook link. Merge logs, traces, and metric drilldowns in dashboards that let you pivot from an alert to the failing SQL, the transform commit, and the sample payload in one click so triage time drops from minutes to seconds.
Continuous monitoring, alerting, and audit form the feedback loop that keeps ETL systems resilient: metrics detect drift, alerts enforce SLOs, audits enable forensic replay, and automated playbooks contain blast radius. As we operationalize these artifacts into dashboards and escalation paths, we turn passive integrity checks into an active reliability practice that shortens mean time to detection and remediation—and prepares us to enforce SLOs programmatically across the pipeline.


