Streaming Architecture Overview
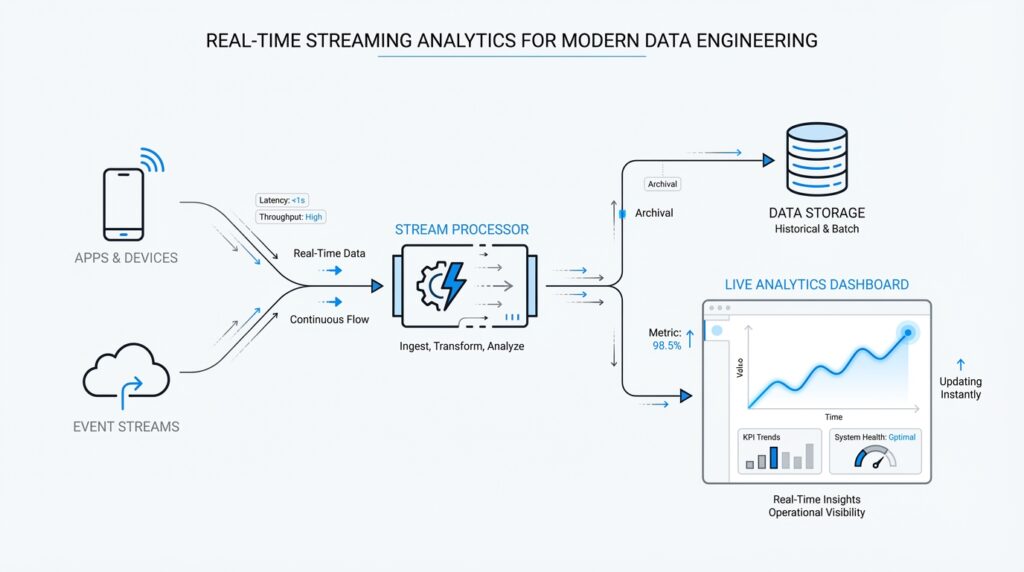
Building on this foundation, a streaming architecture for real-time streaming analytics starts with a simple problem: how do you keep answers fresh when new events keep arriving every second? You can think of the system as a conveyor belt of small facts—an order placed, a sensor reading, a click, a payment—and each fact is an event, meaning one recorded happening. Producers, which are applications that publish events, send those events into a stream platform, and consumers or stream processors read them as they arrive, so the whole pipeline can react without waiting for a nightly batch job. Kafka describes this model as a multi-producer, multi-subscriber event stream, while Flink frames it as stateful computation over unbounded streams.
The next piece is the buffer in the middle, where streaming architecture becomes more than a fast message pipe. In platforms like Kafka and Kinesis, data lands in partitions or shards, which are the units that store and move ordered records; that structure gives us replay, parallelism, and a clean way to scale. This is a bit like splitting a long line of customers into several checkout lanes: each lane keeps its own order, and the system can add lanes when traffic grows. Replication, which means keeping extra copies of the data, adds resilience, so if a machine fails, the stream still has somewhere safe to continue from.
Once the events are flowing, the stream processing engine steps in and does the thinking. This is where real-time streaming analytics becomes interesting, because the engine can count sessions, join related events, or build rolling summaries while the data is still moving. Flink is a good example of this layer: it supports stateful computations, meaning it remembers earlier events in state, and it uses event-time processing, which means it reasons about when something actually happened instead of only when the record reached the system. That matters when events arrive late or out of order, because a watermark—a progress signal for the stream—helps the engine know when a result is ready to be finalized.
After that, the answers need a place to land. Some results flow into dashboards for people, some trigger alerts, and some write into databases or object storage so other tools can use them later; the point is that the stream is not only for live reactions, but also for durable downstream use. Thinking about the architecture this way helps you avoid a common beginner mistake: treating the stream as the destination instead of the road. The stream is the moving lane, while the serving layer is the stop where other systems pick up the finished result and keep the business moving.
The last idea to hold onto is failure handling, because every real system eventually stumbles. A good streaming architecture expects that, so it combines replicated data, distributed processing, and checkpoints—saved snapshots of state that let the engine recover without starting over. Flink’s architecture emphasizes exactly-once state consistency and incremental checkpointing, while Kafka’s design relies on partition replication to keep committed data available during server failures. When you put those pieces together, you get a pipeline that can grow by adding partitions or shards, keep working under load, and resume with minimal drama, which is the real promise of real-time streaming analytics. With that map in place, we can move toward the choices that shape each layer.
Event Ingestion Pipeline
Building on this foundation, the event ingestion pipeline is where real-time streaming analytics meets the messy outside world. This is the first doorway events pass through, and it has to welcome traffic from apps, sensors, logs, and services without losing the shape of what each event means. How do you keep a real-time streaming analytics system from turning into a pile of mismatched records? We start by treating ingestion as a careful handoff, not a simple copy job.
At the edge of the pipeline, producers do more than send data; they package it. Each event usually carries a payload, which is the actual business data, plus metadata, which is the extra information that helps the system interpret it, such as timestamps, source names, or identifiers. This is why an ingestion pipeline matters so much: it gives every event a common envelope before it enters the stream. Think of it like labeling moving boxes before a big relocation. The contents matter, but the label is what lets the receiving system know where each box belongs.
Once the event arrives, the pipeline checks whether it is usable. This is the moment where schema validation, meaning a check that the data matches the expected structure, saves us from downstream confusion. If a payment event arrives without an amount or a device reading comes in as text when the system expects a number, the pipeline can reject it, quarantine it, or route it for repair. That early filter is one of the quiet strengths of an event ingestion pipeline, because it prevents small data mistakes from becoming expensive analytics errors later.
Now that the shape of the data is clear, the pipeline has to decide how to move it efficiently. That is where serialization comes in, which is the process of turning structured data into a format that can travel over the network and be rebuilt later. JSON, Avro, and Protobuf are common choices, and each one helps the pipeline strike a different balance between readability, size, and compatibility. In practice, this is a bit like choosing between a handwritten note, a compact packing list, and a tightly standardized shipping form.
The next challenge is flow. An ingestion pipeline must absorb bursts without collapsing, and it does that by buffering, partitioning, and applying backpressure, which is the system’s way of slowing producers down when consumers cannot keep up. This is especially important in real-time streaming analytics, because a busy morning traffic spike or a product launch can flood the pipeline in seconds. Partitioning also helps the system spread work across multiple lanes, while keying related events together keeps records like all actions from the same customer or device traveling in a predictable path. That balance between speed and order is one of the hardest parts of the design, and also one of the most important.
We also need to think about trust in the data itself. Real streams often include duplicates, out-of-order arrivals, and events that arrive late because networks are imperfect and devices are not always in sync. A good ingestion layer stamps events with source time, preserves enough context for later processing, and avoids rewriting history in ways that make the stream hard to interpret. This is where the pipeline acts less like a pipe and more like a careful gatekeeper, making sure the stream starts with clean, well-formed records that downstream processors can rely on.
When the event ingestion pipeline is designed well, it does something subtle but powerful: it turns scattered activity into a dependable feed for analysis. Instead of asking every downstream service to clean up its own mess, you centralize the first layer of discipline right at the door. That makes the rest of the streaming path easier to reason about, because the data arriving for processing already carries the structure, pacing, and context the system needs. With that in place, we can look next at how those prepared events are transformed once they enter the processing layer.
Event Time and Watermarks
Building on this foundation, we now face one of the trickiest parts of real-time streaming analytics: deciding when an event really happened. That question sounds small, but it changes everything. In a live system, the time an event is created, the time it arrives, and the time it is processed are often different, and if we mix them up, our counts and windows can drift away from reality. This is why event time matters so much: it is the timestamp that says when the event occurred in the real world, not when the pipeline happened to see it.
Think of it like a pile of mailed postcards arriving at your desk. The postmark tells you when each message was sent, while the delivery time tells you when it landed in your hands. In streaming systems, processing time is the delivery time, but event time is the postmark, and real-time streaming analytics often cares more about the story written on the card than the moment it reached your desk. That distinction becomes vital when a sensor reconnects after a network drop, or when a mobile app sends stored activity later than expected. If we only trust arrival time, we may count yesterday’s activity as if it happened today.
So how do you keep a stream honest when events arrive late or out of order? That is where watermarks enter the story. A watermark is a progress signal that tells the stream processor, “We believe we have seen most events up to this point in event time.” It is not a perfect promise, but a practical boundary that helps the engine decide when a window can be closed and a result can be finalized. Without watermarks, the system would hesitate forever, waiting for every possible late record before it committed a result.
This idea becomes easier to feel with a simple example. Imagine you are counting website clicks in one-minute windows, and a few click events arrive thirty seconds late because of shaky network conditions. If the processor sees a watermark that has already passed 10:01, it may safely close the 10:00 to 10:01 window and publish the count. Late events that belong to that window can still be handled according to the rules you choose, but the stream does not have to stop and wait on every straggler. That balance is the heart of event-time processing in real-time streaming analytics: stay accurate without becoming stuck.
Watermarks also give the system a way to manage uncertainty. You can think of them like the tide line on a beach: everything before the line is mostly settled, while everything beyond it might still shift. Different pipelines set that line differently depending on the business need, because a fraud detector may want to wait a little longer for late events, while a live dashboard may prefer speed over perfect completeness. This is why watermarks are not just a technical detail; they are a policy choice that shapes how patient or responsive your analytics should be.
While we covered buffering and partitioning earlier, now we can see why those design choices matter even more. Events may travel through different lanes, arrive in bursts, and land out of order, yet event time lets us reconstruct what actually happened. Watermarks help the stream processor keep moving through that uncertainty, which is especially important when you are building windows, joins, and session-based metrics that depend on timing. In practice, the stream is no longer asking, “What arrived first?” but rather, “What happened first, and how sure are we that the picture is complete enough to share?”
Once you understand event time and watermarks, the rest of the processing layer starts to feel more grounded. You are no longer guessing at freshness or accepting whatever order the network gives you; you are teaching the system to reason about reality with a controlled amount of patience. That is what makes event-time processing such a powerful part of real-time streaming analytics, and it sets us up to look at how those time-aware results are shaped into windows, joins, and continuous calculations next.
Windowed Aggregations
Building on this foundation, the next question is practical: how do you turn an endless stream of events into an answer you can trust? That is where real-time streaming analytics starts to feel less like watching traffic and more like reading a scoreboard. An aggregation is a calculation that combines many events into one summary, such as a count, sum, or average, and a time window is the frame that tells the system which events belong together. Because the stream never really stops, the window gives us a way to say, “This slice of time is complete enough to measure,” which is exactly what we need after learning how event time and watermarks help the system reason about late data.
How do you decide where one summary ends and the next begins? The simplest pattern is a fixed, non-overlapping window, often called a tumbling window, where each event belongs to one time bucket only. Think of it like closing the cash register every five minutes: the numbers for 10:00 to 10:05 are sealed, then a fresh set begins at 10:05 to 10:10. Flink describes tumbling windows as fixed-size windows that do not overlap, and it also notes that window alignment matters, because the boundaries are tied to time semantics rather than to when your job happened to start. In real-time streaming analytics, that makes tumbling windows a good fit for dashboards, hourly reports, and any metric that needs a clean rhythm.
Now that we have the steady version, we can look at the one that behaves more like a moving camera. Sliding windows keep a fixed length, but they advance in smaller steps, so the same event can appear in more than one snapshot when the slide is shorter than the window size. Imagine checking a 10-minute running total every 1 minute: the picture overlaps on purpose, which helps you spot trends without waiting for a whole block to finish. Flink explains that sliding windows can overlap and may assign one element to multiple windows, while Kafka Streams uses sliding windows for certain joins and for windowed aggregations where each unique combination of records appears in one snapshot. That overlap is powerful when you want smoother trends, but it also means you are paying for a richer view of the same traffic.
Some questions, though, are not about clock time at all. Sometimes you care about bursts of activity, which is where session windows come in. A session window groups events by a stretch of activity and closes after a gap of silence, so the boundary is defined by behavior rather than by a fixed schedule. That makes it feel a lot like following a customer through a store: as long as the shopper keeps moving, the visit stays open, but once they leave for long enough, that visit is over and a new one begins. Flink’s documentation describes session windows as non-overlapping windows with no fixed start or end time, and it closes them after a configured inactivity gap; that is why they are so useful for user journeys, support chats, and other stop-and-start patterns.
With those shapes in mind, the real design choice becomes: what question are you asking, and how quickly do you need the answer? Flink notes that window aggregations emit only a final result at the end of the window and then purge intermediate state, which keeps memory use focused on the active slice of time instead of the whole stream. That is a helpful tradeoff in real-time streaming analytics, because it lets the system stay lean while still delivering summaries that line up with event time and watermark progress. So when you choose a window, you are not just picking a time range; you are choosing how patient, how precise, and how memory-aware your analytics should be.
Stateful Processing Patterns
Building on this foundation, stateful processing is where a stream processor starts to feel less like a pipe and more like a memory-bearing assistant. Instead of reacting to each event in isolation, it keeps a small amount of history so it can answer questions that unfold over time. That is the heart of real-time streaming analytics: you are not only asking what happened now, but also what happened before, to whom it happened, and whether the next event fits the same story.
The easiest place to begin is with keyed state, which means memory that belongs to one group of related events. A key is the field the stream uses to keep similar records together, such as a customer ID, device ID, or account number. Think of it like giving each customer their own notebook: one page for running totals, another for the last event seen, and another for whether an alert has already fired. This pattern shows up everywhere, from counting purchases per user to tracking the current temperature of one sensor without mixing it with the rest.
Once that idea clicks, another pattern makes sense: operator state. This is memory attached to a processing step itself, not to one specific key. You can picture it as a shared clipboard for the whole worker, useful when a stream processing engine needs to remember source offsets, temporary buffers, or configuration details that apply across many records. Unlike keyed state, which is split across many customer or device buckets, operator state helps the processor manage itself while it keeps the data moving.
Now that we have the two main memory styles, we can see why stateful processing patterns are so practical in streaming systems. Some questions need you to wait for a matching event, and that means the processor must hold onto the first half of the story until the second half arrives. A common example is a stateful join, where two streams meet, such as a cart event and a payment event, or a click and a profile update. How do you connect those pieces when they may arrive minutes apart? You keep the first event in state, watch for its partner, and then combine them when the match appears.
The same memory trick also helps with deduplication, which means removing repeated events so you do not count the same thing twice. In a real pipeline, duplicate messages can appear because networks retry, producers resend, or downstream systems replay data after recovery. The processor stores recent event IDs in state and checks each new record against that memory before letting it through. This sounds small, but it protects dashboards, fraud checks, and alerts from being inflated by repeated data.
Taking this concept further, state also powers continuous calculations that keep updating as each event arrives. A running average, a moving top-N list, or a live customer session summary all depend on remembering just enough past information to update the answer quickly. This is why stateful processing patterns matter so much in real-time streaming analytics: they let you compute a result without rereading the whole stream every time. It is a bit like keeping a chalkboard on the wall instead of rebuilding the entire lesson after every new sentence.
Here is where things get especially interesting: state is useful only if the engine knows how to protect it. Every piece of remembered data needs a limit, a cleanup rule, or a recovery path, or the system can slowly fill up with forgotten history. That is why stream processors pair state with expiration rules, often called time-to-live, which means a record is kept only for a chosen amount of time before it is discarded. When you combine that with the checkpointing approach discussed earlier, the result is a stream job that can remember what matters, forget what does not, and recover cleanly when something goes wrong.
So when should you reach for a stateful pattern? Reach for it whenever the answer depends on earlier events, whether you are tracking one user, matching two streams, or detecting a meaningful sequence. In practice, the pattern you choose depends on the shape of the question: keyed state for per-entity memory, operator state for task-level memory, and sequence-aware state for joins, deduplication, and pattern detection. Once you can see those shapes, the rest of the processing layer starts to look less mysterious and more like a set of tools built for different kinds of memory.
Monitoring and Alerting
Building on this foundation, monitoring and alerting is where a streaming system stops feeling theoretical and starts feeling alive. You can have a beautiful pipeline on paper, but the moment traffic surges, events slow down, or a checkpoint fails, the story changes fast. In real-time streaming analytics, monitoring means watching the health of the pipeline over time, and alerting means sending a signal when something crosses a line we care about. That difference matters because it turns invisible drift into something you can see before customers feel it.
So what should you watch first? The most useful signals are the ones that tell you whether the stream is keeping up with reality: ingest rate, processing latency, consumer lag, watermark delay, and checkpoint success. Ingest rate is how many events arrive, processing latency is how long the engine takes to handle them, and consumer lag is how far behind a reader sits compared with the latest data. Watermark delay tells you how far event time has progressed, while checkpoint success shows whether the system is saving recovery points as expected. These measurements give you a basic health picture, like checking pulse, temperature, and breathing before deciding what comes next.
Now that we know what to measure, the next question is how to read those signals together. One metric by itself can mislead you, but several moving in the same direction usually tell a clearer story. If lag climbs, throughput drops, and state size keeps growing, the problem may be backpressure, which is the system’s way of slowing down because downstream components cannot keep up. If checkpoints start taking longer and longer, the engine may be struggling to store or recover state efficiently. In real-time streaming analytics, monitoring is less like staring at a single gauge and more like reading a dashboard full of clues.
That same idea applies when we design alerts. An alert should mark a meaningful change, not every small wobble, or you end up with alert fatigue, which is what happens when people get so many notifications that they start ignoring them. A good alert ties to business impact, such as delayed fraud detection, missing sales events, or a dashboard that is no longer fresh enough to trust. Some teams use simple thresholds, like “lag has exceeded five minutes,” while others add anomaly detection, which means flagging behavior that looks unusual compared with normal patterns. The goal is not to create noise; it is to create a short, clear path from problem to action.
It also helps to separate symptom from root cause. A spike in latency may come from a slow downstream database, a sudden burst of events, or a broken partition, and the alert alone may not tell you which one happened. This is where logs and traces become useful companions. Logs are detailed records of what the system did, and traces follow one request or event as it moves through the pipeline. When monitoring and alerting work together with logs and traces, you can move from “something is wrong” to “here is exactly where it broke.”
The best teams also write their alerts around response, not just detection. That means every important alert should lead somewhere: a dashboard, a runbook, or a person who owns the next step. A runbook is a step-by-step response guide, and it helps you avoid guessing under pressure. In practice, this turns real-time streaming analytics into an operational habit instead of a fire drill, because the people on call know whether to restart a job, investigate a downstream service, or widen a watermark threshold when the business can tolerate a little more delay. With that discipline in place, monitoring and alerting become the quiet guardrails that keep the whole pipeline honest while everything else keeps moving.