What Each Role Does
Building on this foundation, let’s map the day-to-day responsibilities you’ll actually see across the Data Analyst, Data Scientist, and Data Engineer roles so you can assign ownership and set expectations clearly. Early clarity here prevents duplication of effort and reduces the “who owns this?” friction that stalls projects. We’ll front-load the core distinctions—analytics and reporting, modeling and experimentation, and infrastructure and pipelines—then show how those threads converge in real work scenarios.
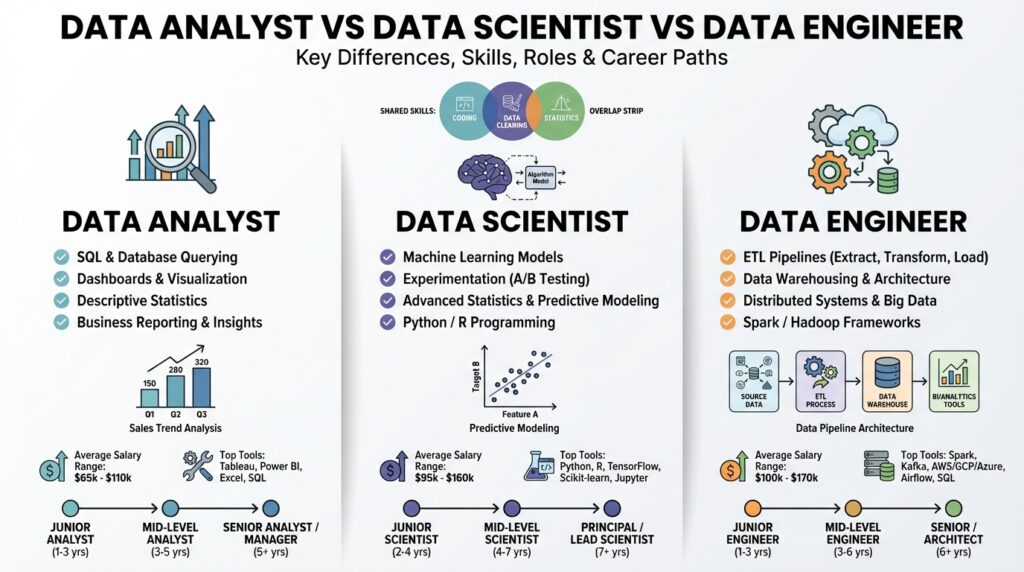
A Data Analyst focuses on turning raw data into actionable insights for business stakeholders. You’ll spend most of your time querying data stores with SQL, designing dashboards in BI tools, and translating metrics into narratives that product managers and executives can act on; this includes defining KPIs, performing cohort analysis, and validating A/B test results. Analysts also own data exploration—finding anomalies, assessing data completeness, and producing reproducible reports—so their work often triggers downstream model features or engineering tasks. In practice, a Data Analyst might be asked to quantify the revenue impact of a new onboarding flow and deliver a dashboard that slices results by user segment.
A Data Scientist builds and evaluates predictive models, applying statistical methods and machine learning to answer higher-order questions. You should expect them to do feature engineering (creating model inputs from raw data), select and validate algorithms, and assess model performance using holdout tests and explainability techniques; feature engineering is the process of transforming raw fields into predictive signals. Data Scientists prototype experiments, iterate on hyperparameters, and produce model artifacts that can be handed to engineering for productionization. For example, a Data Scientist might prototype a churn-prediction model, quantify uplift, and produce a model card describing expected performance and failure modes.
A Data Engineer designs, builds, and operates the systems that make data reliable and accessible—think of them as owners of the data pipeline and its quality. A data pipeline here means the automated workflows that extract, transform, and load (ETL/ELT) data from sources into analytical stores; ETL means extract-transform-load, while ELT delays heavy transformation until after loading. Engineers select storage (lake, warehouse), implement batch or streaming ingestion (e.g., Kafka, Spark), define schemas, and automate orchestration and monitoring. In practice, a Data Engineer will build the pipeline that ingests event data, enforces schemas, implements idempotent writes, and surfaces lineage so analysts and scientists can trust the inputs.
These roles intersect frequently, so team workflows must be explicit about handoffs. Analysts identify patterns and define metric requirements; Data Scientists translate those requirements into label definitions and feature needs; Data Engineers implement the ingestion, transformation, and deployment pipelines that operationalize models and metrics. How do you decide which role should own a project? Assign ownership based on the primary risk: if it’s a business-question and reporting change, the Analyst leads; if it’s statistical validity and model performance, the Scientist leads; if it’s data reliability or scale, the Engineer leads.
Expect practical overlap and role fluidity, especially in smaller organizations. In startups you’ll meet hybrid contributors who function as analyst-engineers or scientist-engineers; in larger enterprises you’ll see tighter specialization with explicit SLAs and data contracts to prevent breakage. Career transitions are common: engineers learn modeling skills to become Data Scientists, analysts learn engineering practices to build robust pipelines—so document interfaces (APIs, SQL views, feature stores) to make those transitions safe and repeatable.
To operationalize these distinctions, define clear responsibilities: who owns instrumentation for events, who validates schema changes, who reviews model drift alerts, and who pushes changes through staging and CI/CD for data. Implement observability (data quality checks, alerting, lineage) so each role can work independently but still collaborate on shared goals. Taking this concept further, we’ll map the specific skills and tooling that typically align with each role in the next section.
Compare Core Responsibilities
Building on this foundation, a practical comparison of day-to-day ownership makes it easier to assign work and avoid duplication across the data analyst, data scientist, and data engineer roles. Right away, recognize that these three roles focus on different risk domains: business insight, statistical validity, and data reliability. We’ll contrast core responsibilities so you can map tasks to skill sets—data analyst, data scientist, and data engineer appear early because they determine how work is partitioned and where handoffs happen. This framing helps prevent the common failure mode where everyone assumes “someone else” owns the same dataset or metric.
The analyst role centers on analytics and reporting: extracting business insight from data and translating it into stakeholder actions. You’ll spend your time writing production-grade SQL queries, designing dashboards in BI tools, and defining and defending KPIs and cohort definitions with product and marketing partners. Analysts also own exploratory analysis and data validation work that surfaces missing events, leakage, or instrumentation bugs; those findings frequently create tickets for engineers and requirements for scientists. In practice, an analyst’s deliverable is often a reproducible report or dashboard that answers a clear business question and provides the operational context teams need to decide.
The scientist role centers on modeling, experimentation, and rigorous evaluation of predictive approaches. You should expect to own label definitions, feature engineering (creating predictive inputs from raw fields), model selection, cross-validation, and explainability analysis that clarifies failure modes. Data scientists prototype algorithms, run randomized experiments or uplift analyses, and produce artifacts—model cards, evaluation notebooks, and performance baselines—that downstream systems must respect. When should a scientist drive an initiative versus an analyst? Choose the scientist when statistical assumptions, causal inference, or model risk dominate the project.
The engineer role centers on infrastructure: building and operating the pipelines, storage, and services that make data trustworthy and accessible. Responsibilities include designing ELT or ETL workflows, choosing batch versus streaming ingestion, enforcing schemas and idempotent writes, and implementing orchestration and observability (data quality checks, lineage, and alerting). You’ll also own operational concerns: scaling ingestion, ensuring downstream-level SLAs, and automating deployments for transformations and models. Data engineers turn analytical requirements into reliable, production-grade systems so analysts and scientists can iterate without firefighting missing or corrupted inputs.
Where responsibilities intersect, explicit handoffs reduce friction: analysts specify metric definitions and investigative queries; scientists convert those definitions into label and feature requirements; engineers implement ingestion and transformation with contracts and monitoring. Consider a churn-prediction project: the analyst quantifies the problem and defines segments, the scientist defines churn labels and prototypes models, and the engineer builds the feature pipelines, deploys the model endpoint, and wires up drift alerts. In this scenario, ownership follows the primary risk—if labeling ambiguity blocks progress, the scientist leads; if unreliable events block features, the engineer leads; if the question itself is underspecified, the analyst leads.
Operationalizing these distinctions means codifying interfaces: SQL views for derived metrics, feature stores or APIs for model inputs, and CI/CD pipelines for data code and model artifacts. Cross-training reduces bottlenecks—teach analysts versioned SQL and basic ETL practices, teach scientists reproducible pipelines and deployment hygiene, and teach engineers the domain context behind metrics. Taking this concept further, we next map the specific skills and tooling that typically align with each role so you can staff teams with the right balance of analytics, modeling, and pipeline expertise.
Essential Skills and Tools
Building on this foundation, the practical difference between the roles shows up most clearly in the skills and tools you use daily: Data Analyst, Data Scientist, and Data Engineer each lean on distinct stacks and practices that shape how work flows across the team. If you want reliable outcomes, you must align ownership to capability—SQL fluency and BI fluency for analysts, machine learning and experimental design for scientists, and robust pipeline engineering for engineers. Front-loading these capabilities prevents the common coordination failures we discussed earlier and speeds the path from question to production-ready insight.
For an analyst, the core skill is turning questions into reproducible SQL and visualizations. You should be able to write performant windowed queries, author parameterized dashboards in BI tools, and implement cohort and funnel analyses that stakeholders can trust; that means versioned SQL, clear metric definitions, and lightweight statistical checks for sample size and significance. Familiarity with ETL concepts (how data lands and is transformed) helps you flag instrumentation gaps and write defensible reports. In practice, a strong analyst will own the canonical metric layer—documented SQL views or metric APIs—so downstream scientists and engineers work from the same facts.
A data scientist needs rigorous modeling skills combined with disciplined experimentation and reproducibility practices. You’ll expect to define labels, perform feature engineering, compare models using proper cross-validation, and produce explainability artifacts (feature importances, SHAP summaries) that inform risk decisions; proficiency in Python and ML libraries such as scikit-learn, XGBoost, or PyTorch is essential. Beyond modeling, you must package experiments into reproducible notebooks, unit-test data transformations, and provide model cards or evaluation documents describing failure modes and performance baselines. When you prototype a churn model, these practices make the handoff to engineering actionable and auditable.
Data engineers focus on scalable, observable pipelines and the infra primitives that make analysis and modeling repeatable. You should be comfortable designing ELT/ETL patterns, implementing streaming ingestion when latency matters, and ensuring idempotent writes and safe schema evolution; tools you’ll use often include orchestration frameworks, distributed compute (Spark or similar), and message systems like Kafka for event-driven architectures. Operational concerns—CI/CD for data code, data quality checks, lineage, and alerting—are central because they reduce firefighting for analysts and scientists. In production, engineers implement feature pipelines and deployment endpoints, and they enforce contracts so model inputs remain stable over time.
There’s a shared tooling surface where collaboration happens, and choosing the right pattern is a pragmatic decision rather than a religious one. Version control, containerization, and CI for data workflows unify teams; a modern stack often combines a cloud data warehouse or lakehouse, a transformation layer (dbt or similar), an orchestration system, and a feature store or materialized view layer for ML inputs. How do you choose between a feature store and materialized views? Use a feature store when you need consistent online/offline feature semantics, lineage, and reuse across models; use materialized views for simple, analytic-derived metrics where online serving and low-latency lookups aren’t required.
For hiring and skill development, favor T-shaped engineers: deep expertise in one domain plus cross-functional fluency in adjacent areas. In early-stage teams, prioritize analysts who can write production-ready SQL and engineers who can provision reliable pipelines; add scientists who can formalize modeling once you have stable metrics and features. Invest in cross-training—teach analysts basic data engineering hygiene, teach scientists reproducible ML ops, and teach engineers the business context behind key metrics—so the team can iterate faster while preserving data quality. Taking these steps will make handoffs cleaner and prepare you to scale both capabilities and tooling in a controlled way.
Daily Tasks and Workflows
When you walk into a morning sprint stand-up on a data team, the day quickly gets triaged into investigation, development, and maintenance work—the three rhythms that distinguish a Data Analyst, a Data Scientist, and a Data Engineer in practice. Building on this foundation, we see analysts spending most of their cycles on SQL-driven exploration and dashboard production, scientists iterating on feature engineering and model evaluation, and engineers stabilizing pipelines and observability so those outputs remain reliable. These roles overlap, but each day will feel different depending on whether your primary risk is business insight, statistical validity, or data reliability.
Start with the analyst workflow: your morning often begins with a ticket or stakeholder request that needs a clear metric and a reproducible query. You write or refine parameterized SQL (for example, windowed queries for retention cohorts), run lightweight statistical checks, and update a dashboard or metric API so product and marketing can act. While executing, you’ll flag missing events or unexpected nulls and create follow-up tickets for instrumenting or transforming raw events, because the fastest path to decisions is clean, versioned analytics that others can consume.
A data scientist’s day centers on experiments and iteration: defining labels, prototyping features, and validating model assumptions with holdout tests. You’ll move between notebooks that show feature distributions and small training runs that validate whether a signal generalizes; expect to iterate on preprocessing (scaling, encoding, leakage checks) and to produce explainability artifacts like SHAP summaries or confusion matrices. When deployment is the end goal, you’ll package the model into reproducible artifacts and produce an evaluation notebook or model card that documents expected behavior and failure modes for engineers.
Engineers focus their time on the plumbing that keeps analysis and modeling reproducible: designing ELT jobs, building streaming consumers, and implementing idempotent writes and schema evolution strategies. Your day includes writing transformations in the orchestration system, adding tests to CI for data quality checks, and tuning ingestion throughput or storage partitioning to meet SLAs. Observability matters: you’ll configure lineage, alerts for freshness and null-rate spikes, and rollback paths so scientists and analysts can iterate without firefighting pipeline outages.
Cross-role handoffs are the connective tissue of daily workflows and require clear artifacts that you can inspect and version. Analysts should deliver canonical SQL views or metric definitions; scientists should hand over feature specs and offline/online consistency tests; engineers should expose stable APIs or feature stores with SLAs. When ownership is explicit—who reviews schema changes, who triages a drift alert, who approves a metric change—teams avoid duplicated effort and wasted cycles.
How do you prioritize when multiple stakeholders request analyses or model features at once? Prioritize by primary risk: if a missing event blocks everyone, escalate to engineering; if label ambiguity halts modeling, the scientist leads; if the question lacks a clear business metric, the analyst drives clarification. Use short, time-boxed spikes for discovery and gate work with measurable acceptance criteria so handoffs are crisp and progress is visible.
In practice, you’ll alternate between planned work (scheduled transformations, model retraining, dashboard updates) and reactive work (investigating anomalies, repairing broken pipelines, or answering urgent stakeholder queries). Build a cadence: morning triage for incidents, mid-day focused development blocks for deep work (feature pipelines, heavy queries), and afternoon reviews or demos so insights translate into action. Automate repetitive checks and surface runbooks to reduce context switching and keep deep work productive.
Taking this concept further, make daily workflows explicit in your team’s rituals and tooling so onboarding and scaling are predictable. Define templates for metric requests, require model cards for new deployments, and codify schema-change processes in pull requests with automated tests. As we map skills and tools next, these operational patterns will determine how smoothly analysts, scientists, and engineers collaborate—and how quickly your data products move from idea to production.
Career Paths and Progression
Building on this foundation, the practical choices you make early in your career shape whether you follow a Data Analyst, Data Scientist, or Data Engineer trajectory. Pick a first focus based on the problems you enjoy solving: if you like translating business questions into SQL and dashboards, you’ll gravitate toward analyst work; if you enjoy statistical modeling and experiments, scientist work fits; if reliable systems and pipelines energize you, engineering is the natural fit. Early clarity about that choice accelerates skill acquisition and makes your first promotions less accidental. For searchability and internal hiring, document your title, core projects, and measurable impact in a single resume artifact.
Early-career progression typically follows a contributor ladder where scope and autonomy expand over time. In the first two to three years you should demonstrate domain mastery—production-grade SQL and BI for analysts, reproducible experiments and baseline models for scientists, and stable ELT/streaming jobs and monitoring for engineers—so you can move from junior to mid-level roles. Expect promotion criteria to require measurable impact (reduced query latency, model lift, pipeline uptime) and ownership of cross-functional deliverables. Aligning your work to those metrics makes career advancement less subjective and more defensible when you negotiate title changes or raises.
As an analyst, mid-career options diverge into specialist and platform tracks: you can become a senior business analyst or product analytics lead focused on stakeholder strategy and complex metric definitions, or transition to an analytics engineer role focused on building the metric layer with dbt, versioned SQL, and observability. In practice, a promotion to analytics lead means owning upstream instrumentation decisions and mentoring analysts in statistical rigor; a move to analytics engineering means owning CI/CD for SQL, tests for data quality, and the delivery of canonical metric views. Both paths increase your leverage—either by influencing product strategy or by reducing engineering toil through automation—and set you up for cross-functional leadership roles.
For Data Scientists, mid-career progression splits between depth and operationalization: you can pursue an applied scientist path (improving model quality and novelty), an ML engineer path (productionizing models, CI for model retraining), or a people-management path. A senior scientist typically owns feature reuse, rigorous A/B testing frameworks, and model cards; an ML engineer focuses on serving latency, online/offline feature consistency, and inference scaling. If you want to lead, aim to demonstrate repeatable model impact and the ability to translate business requirements into technical acceptance criteria—those signals make you a strong candidate for manager or principal scientist roles.
Data Engineers move from building pipelines to owning data platforms and infra patterns as they progress. Mid-level engineers mature into senior roles by designing resilient ELT/ETL patterns, enforcing schema evolution policies, and implementing lineage and alerting that reduce incident toil for analysts and scientists. Beyond senior engineer, you can become a platform engineer or data infrastructure lead who defines storage strategy, cost controls, and feature-store semantics for the org. Showing you can reduce mean-time-to-recovery for data incidents and provide SLAs for consumers is the fastest route to leadership in engineering tracks.
How do you decide whether to switch tracks or double down? Use short, measurable experiments: take a six-month project to build a feature pipeline if you’re an analyst curious about engineering, or ship a reproducible model and an evaluation notebook if you’re an engineer moving toward science. Upskill with targeted projects—write production SQL views, containerize a model in Docker, or implement a Kafka consumer—and record measurable outcomes (dashboard adoption, model lift, pipeline SLO achievement). These experiments create concrete artifacts you can show in promotion packets and during hiring interviews.
Senior progression splits into two durable pathways: the individual contributor ladder (principal, staff, distinguished) and the management ladder (team lead, director, VP). In IC roles you expand influence by setting architecture and data-product standards; in management you expand by hiring, setting priorities, and aligning data work to product outcomes. Employers evaluate senior candidates on different signals: technical depth, cross-functional influence, and measurable organizational impact—so choose the path where you can consistently demonstrate those signals and build a track record of delivered outcomes.
Take a pragmatic approach to planning your career: map 12–24 month milestones, produce demonstrable artifacts for each milestone, and seek mentors who’ve walked your desired path. Create a portfolio that includes canonical SQL views, model cards, and pipeline runbooks so future reviewers can validate your contributions quickly. Taking this concept further, invest time in the adjacent skills we outlined earlier—observability, reproducibility, and cross-role communication—because those investments compound as you move from contributor to leader.
Choosing the Right Role
Building on this foundation, the fastest way to choose between Data Analyst, Data Scientist, and Data Engineer is to match the role’s daily work to the problems you enjoy solving and the risks you’re comfortable owning. If you want repeatable SQL-driven insight, product-facing metrics, and dashboarding, the Data Analyst path aligns with that cadence. If statistical rigor, model design, and experimentation energize you, the Data Scientist path fits. If system design, ingestion, and scalable pipelines excite you, the Data Engineer track is the right match. How do you decide which role fits your strengths and the team’s needs?
Start by mapping primary risk to ownership. When the main risk is “Is this metric correct and actionable?” the analyst should lead; when it’s “Will this model generalize and not introduce harm?” the scientist should lead; when it’s “Can we reliably deliver and serve this data at scale?” the engineer should lead. Use this risk-first filter in triage conversations so you assign a clear owner from day one. This reduces back-and-forth and creates measurable acceptance criteria for each handoff.
Run a short self-assessment that emphasizes time allocation and technical affinity. Ask how much of your week you want to spend writing performant SQL, building visualizations, and working with stakeholders versus prototyping models, running cross-validation, and interpreting feature importances, versus designing ELT/ETL, configuring orchestration, and troubleshooting idempotency and schema evolution. Your preferred time split is a practical signal: 60–80% analyst work suggests continuing as a Data Analyst; 60–80% modeling and experiments suggests Data Scientist; 60–80% infra and automation suggests Data Engineer. Pair that with the skills you enjoy practicing—SQL and BI tools, Python and ML libraries, or Kafka/Spark/Airflow and dbt.
Validate your choice with a small, time-boxed project that produces concrete artifacts. If you’re leaning analyst, deliver a parameterized cohort query and a production dashboard (a canonical SQL view + a documented metric definition). For Data Scientist experimentation, prototype a churn model and produce an evaluation notebook and a model card; a minimal scikit-learn example looks like clf = RandomForestClassifier(n_estimators=100).fit(X_train, y_train) with a SHAP summary for explainability. For Data Engineer validation, implement a simple ingestion pipeline (e.g., Kafka consumer -> Spark job -> write to warehouse) and add a CI test for idempotency and a freshness alert in the orchestration system. These artifacts make your intent visible and evaluable by peers.
Measure outcomes, not effort. Track adoption-level metrics—dashboard adoption and query latency for analysts, AUC/precision uplift and experiment p-values for scientists, and pipeline SLOs, mean-time-to-recover, and null-rate stability for engineers. Create acceptance criteria before starting: a dashboard must be used by at least two teams weekly; a model should show a statistically significant lift in a held-out test; a pipeline must meet a 99.9% freshness SLA for critical tables. Those signals are the evidence you and your manager need for role alignment or a formal transition.
Context matters: smaller companies reward T-shaped contributors and hybrid roles, while larger organizations reward depth and clear SLAs. In a startup you might execute as an analytics engineer—building SQL views and deploying lightweight transformations—whereas in an enterprise you’ll likely operate in a narrower lane with documented contracts and feature stores. When choosing, factor in organizational size, hiring plans, and whether the company values fast iteration over strict separation of concerns.
Finally, plan a 6–12 month learning experiment to confirm the role. Take mentorship from someone in that track, produce the artifacts described above, and record measurable impact on team outcomes. If you iterate and still enjoy the work, double down; if not, use the artifacts to pivot responsibly. Taking this concept further, treat each project as both a contribution and a portfolio piece—canonical SQL views, model cards, and pipeline runbooks make your transition visible and repeatable, and they let the team scale without losing institutional knowledge.