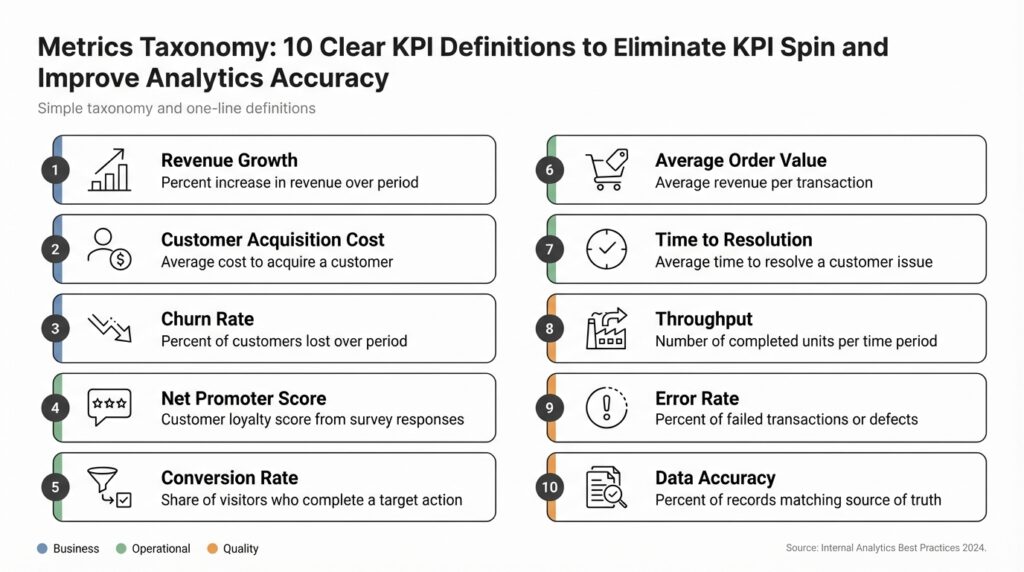
Why a Metrics Taxonomy
Building on this foundation, inconsistent definitions are the silent headache behind every heated dashboard debate and failed A/B test. If different teams calculate the same KPI using different filters, windows, or event sources, you’ll get confident-looking charts that tell contradictory stories and erode trust in analytics. How do you stop KPI spin from skewing decisions? A formal metrics taxonomy—the structured catalogue that defines each metric’s name, formula, window, and owner—gives you the defensible single source of truth you need to restore trust and improve analytics accuracy early in the data lifecycle.
A metrics taxonomy is not a cosmetic naming convention; it’s governance encoded as data. We define a taxonomy entry as a small, machine-readable contract: a canonical metric name, an unambiguous formula (with event and attribute names), the aggregation method (sum, unique count, average), the time window, dimensions, and the metric owner. KPI stands for Key Performance Indicator and denotes metrics tied directly to business outcomes; when a KPI lacks a clear formula or owner, teams invent definitions to fit narratives. By making these contracts explicit you eliminate ambiguity: analysts, product managers, and BI tools all reference the same authoritative definition rather than ad-hoc SQL snippets.
Concrete benefits show up quickly in day-to-day work. First, alignment: your product, marketing, and finance teams stop arguing about whether “conversion” excludes internal traffic or counts refunds; they consult the taxonomy. Second, reproducibility: tests and data quality checks can assert that any computed KPI matches the canonical formula, so reruns of ETL or model updates won’t silently shift numbers. Third, observability: with well-tagged metrics you can track lineage from raw events through transforms to dashboards, making it far easier to triage spikes or regressions. The net result is fewer meetings spent reconciling numbers and more time using metrics to make decisions.
Make the taxonomy practical by choosing a minimal, enforceable schema and embedding it in your data tooling. For example, capture entries like: name=”conversion_rate”, formula=”unique(purchase_id)/unique(session_id)”, window=”7d_rolling”, owner=”[email protected]”, filters=”country != ‘test’”. Store that schema in a central registry (versioned) and surface it through a semantic layer that your BI tools and analytics SDKs query at runtime. When you deploy a change to an event name or filter, update the taxonomy entry and run automated tests that compare dashboard values before and after the change; if values diverge beyond a threshold, a pipeline can automatically open an incident for investigation.
Implementation is organizational as much as technical: assign metric stewards, enforce review gates, and create lightweight SLAs for changes. We recommend treating metric changes like API changes—require a pull request with a changelog, a test demonstrating equivalence where possible, and explicit sign-off from the metric owner. Embed metric-driven unit tests into your CI/CD pipeline and publish a changelog so consumers know when a KPI definition moved. This governance scaffolding reduces accidental rewrites of KPI semantics and turns metric maintenance from tribal knowledge into auditable process.
When taxonomy entries are trusted, your analytics accuracy improves and your teams can make faster, more defensible decisions. You’ll see downstream benefits in cleaner A/B analyses, fewer dashboard disputes, and more predictable executive reporting because every stakeholder references the same definitions. Taking the taxonomy approach prepares us to define the ten KPIs we’ll standardize next, including canonical formulas, ownership, and test cases that eliminate KPI spin at the source.
Classify Metrics by Type
Building on this foundation, the next step is to stop treating all metrics as interchangeable numbers and instead categorize them so everyone understands what a metric actually measures and how it should be used. Classifying metrics by type is a practical way to encode intent into your metrics taxonomy and reduce KPI spin: it tells you whether a metric is an event count, a ratio, a distribution, a gauge, or a qualitative flag, and it clarifies the appropriate aggregation, window, and owner. When you front-load type information into the registry, consumers immediately know what questions the metric can reliably answer and which downstream analyses are safe to run against it.
Start by defining a small set of orthogonal classification axes that will be part of every taxonomy entry: data shape (count, unique, distribution, boolean), normalization (absolute vs rate), temporal semantics (instantaneous gauge, cumulative, rolling window), and cardinality/dimensionality (high-cardinality user set vs low-cardinality cohort). For example, mark DAU as a unique_count + daily_rolling window + user_dimension, while CPU_utilization is a gauge + instantaneous snapshot + host_dimension. These explicit labels prevent common mistakes—like normalizing a daily unique user metric by total events or treating a distribution (latency histogram) as a simple average.
Differentiate raw event metrics from derived or computed KPIs and capture where the computation should occur. Raw events are single facts (purchase.created) useful for flexible ad-hoc analysis, while derived metrics are canonical formulas like conversion_rate = unique(purchase_id) / unique(session_id) that belong in the semantic layer. Decide whether derivations live in the streaming layer for near-real-time dashboards or in batch for reproducible reporting, and record that decision in the taxonomy so pipelines and tests can be aligned. This separation also guides data-quality checks: validate event integrity for raw metrics and formula correctness for derived KPIs.
Separate business KPIs from system and health metrics, and tag whether a metric is leading or lagging relative to business outcomes. Business KPIs—revenue, conversion_rate, churn—map directly to strategic decisions and should have clear owners and change-review policies; health metrics—error_rate, queue_depth, CPU_utilization—drive operational alerting and SLOs. How do you decide which metrics are primary versus supporting? Classify primary KPIs as those used in executive reporting or experiment evaluation and label supporting metrics as diagnostic; require owners to sign off on any change to primary KPI definitions.
Make the type field concrete in the registry and use it to drive enforcement. A minimal entry might look like: name=”conversion_rate”, type=”ratio”, aggregation=”distinct”, numerator=”purchase_id”, denominator=”session_id”, window=”7d_rolling”, unit=”percent”, owner=”[email protected]”. Use these fields to generate CI tests that assert metric equivalence after schema or event-name changes, and to automatically configure visualization defaults (aggregation, axis scaling, and suggested dimensions). Capturing unit and stability (how often the definition can change) reduces interpretation errors when downstream analysts combine metrics from different sources.
Taking this concept further, use metric type to automate lifecycle policies: provisioning alerts for health metrics, tagging primary KPIs for audit trails, and routing high-cardinality distributions into cost-optimized storage. When your semantic layer and monitoring systems respect the taxonomy’s type metadata, dashboards, experiments, and SLOs all draw from a consistent contract rather than ad-hoc SQL. The immediate payoff is fewer reconciliation meetings and faster, more confident decisions—so let’s use these classifications to prepare the canonical KPI definitions we standardize next.
Standard KPI Definition Template
Building on this foundation, the fastest way to eliminate KPI spin is to make each KPI definition a small, machine-readable contract you can validate and version. We front-load important keywords here—KPI definition, metrics taxonomy, canonical metric, and metric registry—because those fields drive automation, tests, and governance. If you treat a KPI definition as informal notes or scattered SQL snippets, teams will inevitably diverge; if you encode it, you force clarity and reproducibility. This section gives a practical template you can copy into your registry and integrate with a semantic layer and CI pipelines.
Start with a concise statement of intent: what business outcome this KPI signals and why it matters. The template should include: a canonical metric name that follows a predictable naming convention; an explicit formula that references event and attribute names as they exist in the warehouse or event stream; the aggregation method (sum, distinct_count, average) and unit; and a clearly defined time window (daily, 7d_rolling, monthly). Include who owns the metric so change requests have an accountable reviewer; without an owner, definitions will mutate under pressure.
Make the schema machine-friendly by including typed fields for filters, dimensions, and stability metadata, and store it as JSON (or YAML) in your metric registry. For example:
{
  "name": "conversion_rate",
  "display_name": "Conversion Rate (7d)",
  "type": "ratio",
  "numerator": "distinct(purchase_id)",
  "denominator": "distinct(session_id)",
  "aggregation": "rate",
  "window": "7d_rolling",
  "unit": "percent",
  "filters": "country != 'test' AND user_type != 'internal'",
  "dimensions": ["country","platform"],
  "owner": "[email protected]",
  "stability": "quarterly",
  "version": "v1.3",
  "description": "Canonical conversion rate used for executive reporting."
}
Each field in that JSON serves a purpose. The numerator and denominator force a single canonical formula so that analysts and BI tools compute the same value; filters capture exclusion rules (internal traffic, test rows, refunds) so downstream dashboards don’t invent their own masks; dimensions list the permissible breakdowns to protect performance and cardinality assumptions. Version, stability, and a short description provide the governance metadata that tells you when a change is substantive and who must sign off.
How do you ensure metric changes don’t break dashboards? Embed automated metric equivalence tests into CI that run after a schema change or event rename. We run a smoke query comparing the old definition to the new one on a representative historical window and flag differences beyond a tight threshold, automatically opening an incident for the metric owner if results diverge. Use type annotations (ratio, count, gauge) in the template to drive test selection: distribution metrics get KS-tests, ratios get numerator/denominator comparisons, and gauges validate snapshot semantics.
Operationalize the template with lightweight process rules: require a pull request for any change to a canonical metric, include a changelog entry that explains business impact, and set an SLA for owner review. Assign metric stewards who triage disputes and keep the metric registry as the single source of truth for the semantic layer. When the template is enforced by tooling, you free analysts to focus on insight rather than reconciliation and you make audit trails usable for compliance and postmortems.
Finally, treat the template as living infrastructure that connects taxonomy, lineage, and testing. By encoding KPI definition, filters, aggregation, owner, and version in a single registry entry, you make metrics discoverable, auditable, and testable across the analytics stack. Next, we’ll apply this template to the ten canonical KPIs we standardize, pairing each definition with owner responsibilities and CI test cases so we stop interpreting numbers and start trusting them.
Specify Calculation Rules
Building on this foundation, the most consequential part of turning a KPI into a trusted signal is specifying the exact calculation rules that implement it. If you treat a KPI definition as a loose description, different teams will re-implement it in incompatible ways; instead, we write deterministic, machine-readable rules that leave no room for interpretation. These rules are the operational contract that lives alongside the canonical metric in your metrics taxonomy and drives reproducibility across dashboards, experiments, and reports. When we get these rules right, downstream disagreements about what a number means disappear.
At its core, a calculation rule is a precise recipe: the formula, the allowed inputs, the aggregation method, the temporal semantics, and the exceptions. Define the exact event names and attribute keys to use, the deduplication key (for example event_id or payment_id), and whether you apply distinct counts or raw sums. State the time window (daily snapshot, 7d_rolling, monthly cumulative) and the timezone semantics (UTC vs business-local) so analysts compute the same windows. Include ownership and a version tag in the metric registry entry so changes are auditable and reversible.
Practical rule components matter because small differences yield large numeric drift. Specify whether to exclude test or internal traffic, how to treat refunds and chargebacks (exclude, net, or separate), and how to handle partial failures (for instance, retry logic that may create duplicate events). Address late-arriving data by declaring a watermark policy and a backfill window—e.g., accept late events up to 48 hours, treat anything older as historical and require a manual re-run. Clarify aggregation semantics: is unique(user_id) computed per calendar day, session, or across the entire window? These specifics determine whether a metric is stable enough for experimentation versus exploratory analysis.
Edge cases deserve explicit rules rather than footnotes. How do you handle multiple event sources that report the same reality (client-side and server-side purchase events)? Declare a precedence order and a canonical source of truth to avoid double-counting. For attribution, name the model (first-touch, last-touch, time-decay) and the attribution window; document whether multi-touch is denormalized into event-level attributes or computed at query time. Below is a compact machine-readable example you can copy into a registry entry:
{
  "name":"purchase_revenue_net",
  "formula":"sum(if(event='purchase' AND status='completed', amount, 0)) - sum(if(event='refund', amount, 0))",
  "dedupe_key":"transaction_id",
  "window":"monthly_cumulative",
  "late_event_policy":"48h_watermark",
  "source_precedence":["server_purchase","client_purchase"],
  "owner":"[email protected]",
  "version":"v2.0"
}
Implementation patterns enforce these rules programmatically. Surface the calculation rule in your semantic layer so BI tools request the canonical SQL or compiled expression rather than freeform SQL fragments. In CI, run equivalence tests that compare the canonical expression to any proposed change across representative historical windows and fail the PR if differences exceed a defined threshold. Use deterministic SQL patterns to deduplicate (for example row_number() OVER (PARTITION BY transaction_id ORDER BY received_at DESC) = 1) and consistent timezone conversions (AT TIME ZONE ‘UTC’) to ensure repeatable results.
Governance ties the technical rules to organizational practice. Require a pull request with a changelog entry and owner sign-off for any modification to a KPI definition; classify changes as non-breaking metadata edits versus breaking semantic changes that trigger downstream alerts. Tag primary KPIs with stability metadata (weekly, quarterly) so consumers know the expected cadence of change. Finally, block or warn dashboard queries that bypass the registry to keep the canonical metric as the single source of truth.
Taking these steps ensures that when we publish a KPI definition in the metric registry, it’s executable, testable, and trustworthy. As we apply this level of rigor to the ten canonical KPIs we standardize next, we’ll pair each definition with test cases, ownership rules, and CI gates so teams can rely on numbers instead of arguing about them.
Map KPIs to Objectives
Building on this foundation, the single biggest guardrail against KPI spin is an explicit mapping from business objectives to the canonical metrics in your metrics taxonomy and metric registry. Start by treating objectives as contracts with measurable signals: each objective should name the primary outcome you care about, the time horizon, and the stakeholders who will act on the signal. When you capture that intent alongside a pointer to the canonical metric entry, you turn vague goals into auditable, testable commitments that analysts and product teams can align to.
Choose small, actionable sets of metrics for each objective rather than long lists of vanity numbers. For most objectives we recommend 1 primary KPI and 1–2 diagnostic metrics: the primary KPI measures the outcome decision-makers will act on, while diagnostics explain why it moved. For example, an “Improve new-user activation” objective might map to activation_rate (primary), with session_length and onboarding_step_completion as diagnostics. Link each metric to its registry entry so the definition, window, and owner are enforced, not reinterpreted at visualization time.
Make the mapping machine-readable so you can automate checks, ownership routing, and dashboard binding. Embed a compact mapping record in your metric registry that includes objective_id, canonical_metric, owner, target, cadence, and sensitivity. For instance:
{
  "objective_id": "obj_onboarding_q2",
  "name": "Improve new-user activation (Q2)",
  "primary_metric": "activation_rate_v1",
  "owner": "[email protected]",
  "target": "+8% absolute by 2026-06-30",
  "cadence": "weekly",
  "diagnostics": ["avg_session_length","onboarding_step_completion"]
}
This pattern forces you to quantify success and declare who will act when the number is off-target. When selecting a primary metric, prefer actionability and low ambiguity: choose metrics with deterministic calculation rules in the metrics taxonomy and a clear causal link to the objective. Avoid metrics that are easily gamed or that lag so far behind actions that they cannot guide tactical choices; if a metric is lagging but unavoidable for reporting, pair it with a leading diagnostic so teams can iterate.
Operationalize mapping with tests and alerts that respect the mapping metadata. Wire CI checks to validate that any change to a canonical metric triggers a compatibility test against objectives that depend on it, and fail the change if variance exceeds a threshold. Configure alerts not on raw counters but on mapped objectives: an objective-level alert should consider the primary KPI, its window semantics, and the diagnostic ensemble so on-call and product owners receive a single, contextual signal rather than a flood of unrelated alarms.
How do you know when a diagnostic becomes a primary KPI? Promote it when it consistently correlates with the objective, is more actionable, and can be defined deterministically in the registry. Use statistical tests and backfill comparisons to validate promotion: show historical equivalence or superior sensitivity, update the mapping entry with versioning, and require owner sign-off. Treat these promotions as governance events—document the rationale and expected behavioral change so downstream dashboards and experiments remain trustworthy.
Taking this approach reduces noisy debates about definitions and focuses conversations on trade-offs and remediation. By mapping objectives to canonical metrics in the metric registry and aligning owners, cadence, targets, and diagnostic complements, you make metrics a decision-making fabric rather than a source of disputes. Next, we’ll apply this mapping pattern to the canonical KPI set so each metric not only exists in the taxonomy but drives a concrete business decision.
Governance, Ownership, Review
Building on this foundation, the single most powerful lever to stop KPI spin is a disciplined governance and change process that treats metrics like APIs: versioned, contract-driven, and access-controlled. In a metrics taxonomy, governance means defining who can propose, approve, and deploy a change to a canonical metric and under what conditions. You should front-load the metric registry record with not only the formula and window, but also the change class (non-breaking metadata vs breaking semantic), expected reviewer roles, and the SLA for review. How do you prevent definitions from quietly drifting? You make those rules executable and visible to everyone who queries the metric.
Start by assigning concrete roles and responsibilities so ownership is actionable rather than symbolic. Define a metric owner as the accountable product or business contact who approves semantic changes, and a metric steward as the technical custodian who implements tests, CI gates, and deploys updates to the semantic layer. For each canonical KPI definition include contact, escalation path, and stability metadata (for example: “owner: [email protected]”, “stability: quarterly”). This reduces ambiguity during disputes—finance knows who to call when revenue definitions change, and product knows who signs off on changes that affect experiments.
Embed review into familiar engineering workflows so changes are auditable and reversible. Require a pull request for any registry edit, include a short changelog that explains business impact, and attach an automated equivalence test that compares old and new definitions across representative historical windows. In CI run deterministic checks—row_number() dedup patterns, timezone conversions to UTC, and numerator/denominator comparisons for ratios—and fail the PR if drift exceeds a conservative threshold. When tests fail, route the incident to the metric owner automatically rather than letting a dashboard divergence become a surprise during executive reporting.
Enforce access controls and runtime guards so consumers can’t bypass the canonical source of truth. Configure your semantic layer and BI tooling to reject queries that reference a metric name other than the registry canonical name, or to surface a prominent warning when a dashboard uses an ad-hoc SQL fragment. Implement RBAC (role-based access control) or ABAC (attribute-based access control) rules so only stewards can publish new metric versions, while analysts retain read access to all stable entries. Maintain an immutable audit log of registry changes and link each change to the CI run, the PR, and the owner’s sign-off to make postmortems and compliance trivial.
Operationalize cadence and exception handling so governance is lightweight in normal flow and fast in emergencies. Schedule quarterly metric audits that validate primary KPI definitions against production queries and experiment results, and run a monthly smoke test for high-impact metrics used in executive reporting. Define an emergency change process with tighter post-deploy monitoring windows and automatic rollback criteria—if a new version produces >X% variance on the primary KPI in a 24-hour sample, revert automatically and open an incident. Treat promotions of diagnostic metrics to primary KPIs as governance events: require historical validation, owner sign-off, and a documented rollout plan.
When governance, ownership, and review are practical and automated, your metrics taxonomy becomes durable rather than brittle. We’ll use these controls to keep the metric registry dependable as we standardize the ten canonical KPI definitions that follow, ensuring every dashboard, experiment, and objective points back to a single, auditable contract rather than to competing interpretations.