Why AI Analytics Matters
If you’ve ever stared at dashboards that show what happened last quarter and wondered how to act now, you’re not alone. AI analytics puts predictive analytics and real-time analytics into your operational flow so you can move from reactive reporting to proactive decision-making. How do you turn that historical data into a competitive advantage right now? We’ll show why integrating AI analytics into product, operations, and customer workflows changes how you prioritize work, allocate budget, and measure ROI.
At a technical level, AI analytics combines statistical models, machine learning, and fast data pipelines to surface high-value signals from noisy datasets. Predictive analytics—models that forecast a future outcome based on historical features—lets you estimate risk, demand, or user behavior before it occurs. Real-time analytics augments those forecasts with streaming signals so you can trigger actions within seconds rather than days. Together, these approaches reduce decision latency and increase the value of each data point you collect.
You see the payoff in concrete business processes: personalize user onboarding to lift activation, preempt equipment failure to avoid costly downtime, or optimize pricing dynamically to protect margins during volatility. For example, an online subscription service can use churn propensity scores from AI analytics to target offers to users at risk of leaving, improving retention while avoiding across-the-board discounts. In supply chains, anomaly detection models on telemetry reduce stockouts by flagging abnormal lead times before they cascade into missed deliveries. These are not theoretical gains; they change KPIs you report to stakeholders every quarter.
Implementing this requires more than dropping a model into a data lake. Start by cataloging signal quality: capture lineage, schema evolution, and missingness rates so you understand what the model actually learns. Invest in feature stores to centralize reusable features and accelerate experimentation. Use MLOps practices—automated CI/CD for models, drift monitoring, and rollback strategies—so you can deploy AI-powered analytics with the same rigor as application code. For example, wrap model inference behind a lightweight microservice with rate limiting and A/B testing hooks so you can iterate safely without exposing users to instability.
There are practical constraints you must weigh when deciding where to apply AI analytics. Data privacy, regulatory constraints, and model bias can turn a successful pilot into a governance headache if you’re not careful. Measuring ROI requires instrumenting not only model performance metrics but downstream business metrics—conversion lift, reduced mean time to repair, or cost avoidance—to justify ongoing investment. When data is sparse or rapidly shifting, simpler statistical models with strong interpretability may outperform complex black-box models; choose the approach that balances accuracy, explainability, and operational cost for your context.
Building on this foundation, we can now examine the top use cases that deliver the highest ROI and the concrete implementation patterns that make them sustainable. In the next section, we’ll map specific business problems to AI-powered analytics architectures, show minimal reproducible pipelines, and outline the monitoring signals you should instrument from day one so models remain reliable as production data drifts.
Choose High-Value Use Cases
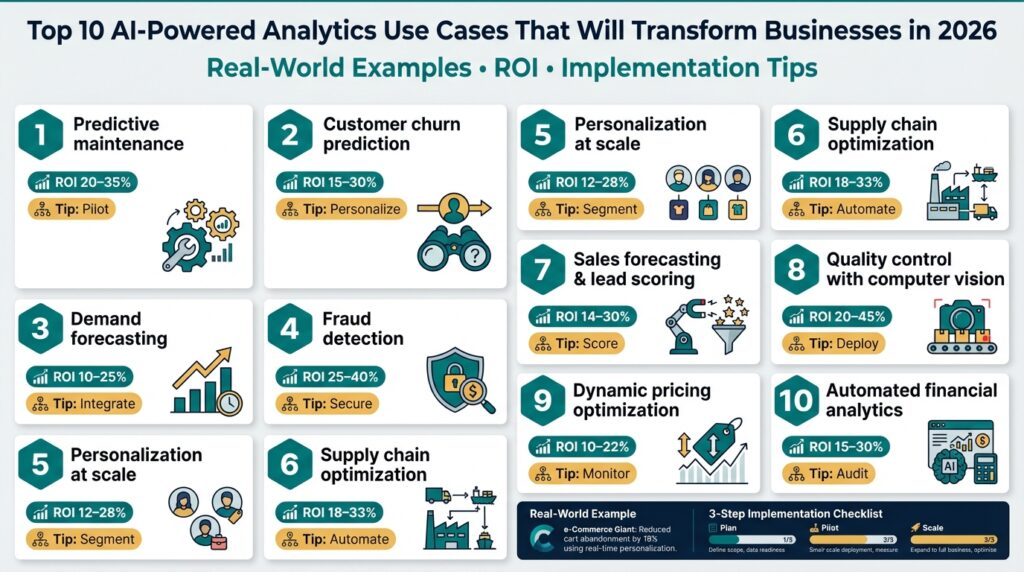
AI analytics and predictive analytics should be chosen where they change a decision you make or an action you can automate — that is the single litmus test for high-value projects. If a model’s output does not shorten decision latency, reduce cost, or create measurable revenue, it becomes a dashboard exercise rather than a business lever. We prioritize real-time analytics where milliseconds matter (fraud scoring, inventory routing) and predictive analytics where a window of days or weeks enables planning (demand forecasting, maintenance), because matching model latency to the business action reduces wasted engineering effort and maximizes ROI.
Start by scoring candidate problems along four dimensions: impact, measurability, data readiness, and integration cost. Impact estimates the financial or operational delta (revenue lift, downtime avoided, cost saved). Measurability asks whether you can run A/B tests or measure downstream KPIs tied to the model’s decisions. Data readiness inspects label quality, lineage, and volume. Integration cost accounts for engineering work to deploy, monitor, and rollback models; projects with low integration friction and clear KPIs are typically prioritized first.
Assessing signal quality is a practical step many teams skip, but it separates pilots from production winners. Audit event schemas, missingness patterns, and label leakage before modeling — if 70% of your key features change schema monthly, you will spend more time fixing pipelines than improving accuracy. Validate offline metrics against small online experiments: run shadow inference in production traffic and compare predicted distributions to live outcomes to detect label drift or hidden confounders. This early validation reduces waste and surfaces operational constraints like stateful feature requirements or low-cardinality IDs that complicate serving.
How do you decide between quick wins and strategic bets? Use a two-track portfolio: pick one or two quick wins with high signal-to-noise and fast integration (churn propensity scoring to prioritize retention offers, basic anomaly detection to reduce incident MTTR) and complement them with a strategic bet that requires more data or orchestration (predictive maintenance across heterogeneous assets, dynamic pricing across product categories). Quick wins build confidence, produce initial ROI, and fund engineering time for strategic systems that deliver larger, systemic value over months.
Adopt minimal viable pipelines that map to the use case’s latency and reliability needs. For batch use cases, schedule ETL and model scoring with a reproducible workflow (Spark or a cloud dataflow) feeding downstream dashboards and A/B test cohorts. For near-real-time decisions, wrap inference in a lightweight microservice with gRPC/REST endpoints, deploy behind a feature cache or feature store, and instrument request tracing and rate limiting. We recommend treating models like product code: include CI for feature generation, canary deployments, and automated rollback triggered by predefined business-metric degradation thresholds.
Measuring ROI requires instrumenting business metrics as early as model development. Define the counterfactual: what would have happened without the model? Run randomized experiments where possible and measure both lift (conversion, retention) and cost avoidance (reduced overtime, fewer false positives). Factor in total cost of ownership: engineering hours for pipeline maintenance, cloud inference costs, and monitoring. Don’t neglect governance — tie privacy, explainability, and bias checks into the acceptance criteria so model performance improvements aren’t undone by compliance rework downstream.
Start small, iterate fast, and always tie models to an executable action. Select one measurable pilot, lock a clear success metric, and plan for a follow-up project that scales the winner’s architecture. Building on the foundations we covered earlier — feature stores, MLOps, and drift monitoring — this prioritization approach helps you allocate scarce engineering time where AI analytics will deliver repeatable, auditable, and high-return outcomes; next we’ll map these selected problems to concrete architectures and monitoring signals so you can move from pilot to production with confidence.
Demand Forecasting and Inventory Optimization
Building on this foundation, the value of accurate demand prediction and tight inventory planning shows up in concrete dollars and service-level improvements within weeks—not months. If you’ve wrestled with stockouts during promotional spikes or excess carrying costs after a forecast miss, you know those problems cost both revenue and customer trust. We’ll treat demand prediction as an actionable signal—not a dashboard metric—so you can convert probabilistic outputs into replenishment decisions, dynamic safety stock, and supply commitments that align with commercial risk tolerances.
Start by matching model latency and horizon to the decision you want to change. Short horizons and streaming signals are appropriate for fulfillment routing and intraday replenishment; weekly or monthly horizons work for supplier orders and capacity planning. We recommend centralizing features in a feature store and versioning the training pipeline so you can iterate on horizon choice quickly: run parallel experiments for 1-day, 7-day, and 28-day forecasts and measure downstream cost and fill-rate impact rather than only improving pointwise error.
Feature engineering drives most of the lift in demand models, so instrument causal signals early. Create promotion encodings, price-elasticity features, holiday/event calendars, lead-time-aware features, and rolling demand aggregates with explicit decay (for example, 7-, 28-, and 90-day EWMA). Here’s a compact pattern you can use in Python to produce lag and rolling features in a reproducible transform step:
df['lag_1'] = df.groupby('sku')['demand'].shift(1)
for w in (7,28,90):
    df[f'ewma_{w}'] = df.groupby('sku')['demand'].transform(lambda x: x.ewm(span=w).mean())
When you evaluate models, go beyond MAE and MAPE: quantify bias, probabilistic calibration, and economic impact. Measure bias separately for promoted and base periods because systematic under-forecasting during promotions drives costly stockouts. Use quantile or pinball loss to produce prediction intervals instead of single-point forecasts—these intervals feed optimizers that choose reorder points and safety stock. How do you decide which metric to optimize? Choose the one that maps directly to the business objective—minimized lost sales, minimized holding cost, or a weighted combination of both.
Translating probabilistic predictions into replenishment requires a policy layer that encodes your service-level targets and supplier constraints. For single-period decisions you can use the newsvendor principle, setting the critical fractile from unit shortage vs. holding cost; for multi-period, multi-echelon problems, formulate a constrained optimization (mixed-integer or convex) that minimizes expected total cost subject to fill-rate constraints. A frequently deployed heuristic is safety_stock = z * sigma_demand * sqrt(lead_time), where z is chosen from desired service level; compute z from the quantiles your model outputs to align uncertainty estimates with inventory buffers.
Operationalize with the MLOps practices we discussed earlier: run shadow inference on production traffic, route a percentage of orders to model-driven replenishment via canary releases, and instrument real business KPIs (stockouts prevented, carrying-cost delta). Close the loop: feed realized sales and supplier lead-time variability back into the training set nightly or weekly, monitor data drift on core features, and automate retraining triggers tied to degradation in downstream cost metrics. By treating demand prediction as an integrated signal in your replenishment system, we turn forecasting into a lever you can tune, test, and scale—so supply decisions become faster, cheaper, and measurably closer to customer demand.
Predictive Maintenance and Operations
Building on this foundation, treating equipment health as a high-value signal changes how you prioritize work and budget for downtime. Predictive maintenance and operations rely on AI analytics to turn noisy sensor streams and logged incidents into actionable alerts that shorten decision latency and reduce mean time to repair. When you can predict a failure window rather than react after a breakdown, you convert surprise outages into scheduled interventions that cost far less and keep revenue streams intact. This section shows how to move from predictions to defensible maintenance actions you can deploy reliably.
Choose modeling approaches that match the decision horizon and failure mode you care about. Time-to-event (survival) models are appropriate when you need a hazard rate or remaining useful life estimate, while binary classifiers work for short-horizon alarms; probabilistic regression fits when lead time matters. Use probabilistic outputs and calibrated intervals rather than hard labels so you can trade false positives for avoided downtime explicitly. In practice we combine models: a fast streaming classifier for immediate triage and a slower survival model for planning spares and crew schedules.
Feature engineering is where most of the lift lives for operational models; invest there first. Align time series by event, compute rolling aggregates with decay (exponentially weighted means), and surface domain signals such as vibration harmonics, temperature gradients, and firmware-version interactions. Store these in a feature store with timestamped lineage so you can reproduce training and serve features consistently in production. Handle missingness explicitly—forward-fill only when physically justified—and instrument sensor health metrics because telemetry gaps often masquerade as normal readings.
Translating probabilities into action requires an explicit policy layer that minimizes expected cost. Frame the decision as: schedule maintenance if P(failure within horizon) * Cost(failure) > Cost(preventive maintenance) + Cost(downtime_to_schedule). For example, an inline rule might look like: if p_failure_7d * 100000 > 5000 then schedule_work_order. This expected-cost logic makes the economic trade-off visible and lets you tune service levels per asset class, supplier lead time, and SLA penalties rather than arbitrarily picking thresholds.
Operational rigor is non-negotiable: deploy models in shadow mode, run canaries on a controlled fleet segment, and instrument both model and business metrics. Monitor calibration drift, false alarm rates, and downstream KPIs like mean time between failures and technician utilization. Integrate explainability—SHAP or counterfactuals—to highlight which sensors drove a prediction so technicians trust and verify alerts instead of ignoring them. Automate retraining triggers based on data drift in core features or degradation in cost-based KPIs, and version every model, feature transformation, and decision-policy change as part of your MLOps lifecycle.
Consider a concrete example to connect these pieces: a wind-farm operator uses vibration spectra plus SCADA telemetry to predict gearbox failures three weeks out, routing high-probability turbines to prioritized inspections and spare allocation. The result: fewer catastrophic failures, lower logistic cost for helicopter lifts, and measurable ROI reported as avoided replacement cost and uptime improvement. As we continue, we’ll map these operational patterns to architectures and monitoring signals so you can take a small pilot—shadow inference, cost-rule policy, and a single work-order integration—and scale it across heterogeneous fleets with confidence.
Customer Personalization and Churn Prediction
Building on this foundation, think of customer personalization and churn prediction as two sides of the same operational coin: one increases lifetime value by tailoring experiences, the other preserves it by flagging at-risk accounts early. Customer personalization and churn prediction should be front-loaded into your product and marketing flows so you can act within the decision window that matters—minutes for in-app promotions, days for retention campaigns. We’ll treat model outputs as actionable signals, not dashboards, and show how to convert propensity scores into cost-aware policies you can run at scale.
Start by defining the decision you want to change and instrumenting the right labels and signals. For churn prediction, that means a precise churn definition (subscription cancellation, 30-day inactivity, downgrades) and a labeled lookback window that matches business cadence; for personalization, it means tracking conversion events, time-to-next-action, and downstream revenue per cohort. How do you prioritize who gets an offer without overspending on discounts? Frame that as an expected-value calculation: expected_lift * margin > offer_cost, and make sure your logging captures both delivered offers and holdout responses so you can estimate the true counterfactual.
Feature engineering drives most of the lift for both personalization and churn propensity models, so centralize features in a feature store with timestamped lineage as we recommended earlier. Create session-level features (last N actions, dwell time), lifecycle features (days since last purchase, tenure buckets), and product affinity signals (co-purchase counts, embedding distances from collaborative filtering). Combine behavioral embeddings from your recommendation pipeline with tabular customer attributes and use time-aware aggregations (EWMA, recency-weighted counts) to keep signals aligned with the prediction horizon; persist these in both training and serving stores to avoid train/serve skew.
Choose modeling patterns that map to the operational decision: a calibrated probability for churn prediction and a multi-armed contextual bandit or uplift model for personalization at scale. Calibration matters—if your model outputs p = 0.2 for churn, that probability should reflect the observed frequency; otherwise your cost-rule thresholds will be wrong. Deploy a lightweight inference service behind a feature cache and expose a small decision API where the policy layer evaluates rules like if p_churn_7d * expected_ltv > retention_cost then trigger_offer or if uplift_score > threshold and cost_per_acquisition < budget then recommend. Route traffic through canaries and shadow-mode scoring first so you can compare predicted distributions to realized outcomes without impacting customers.
Experimentation and ROI measurement must be baked into your rollout. Run randomized holdouts for retention offers and track absolute lift in retention rate and net margin rather than only model accuracy metrics. For personalization, prefer uplift or bandit-based evaluation that isolates causal effects of treatment; measure both short-term conversion and longer-term churn impact since aggressive personalization can temporarily increase conversions while increasing churn later. Estimate total cost by including offer costs, support load, and potential cannibalization, and set automated retraining triggers when uplift or calibration degrades beyond your business-tolerated delta.
Operational governance — explainability, fairness, and privacy — determines whether these systems remain maintainable. Surface per-decision explanations using SHAP values or counterfactual rules so product owners and agents can trust recommendations and verify edge cases. Monitor cohort-level performance to detect disparate impact (for example, retention offers systematically under-serving a high-value demographic) and apply privacy-preserving transformations or differential-privacy noise when using sensitive attributes. Version models, document acceptance criteria, and tie retention policies to approved governance checks in your CI pipeline.
Finally, instrument the right monitoring signals from day one: calibration curves, uplift drift, feature missingness rates, and business KPIs like net-churn and ARPU by cohort. Automate alerting that ties model drift to expected revenue impact so you can roll back or retrain before degradation becomes a business outage. By treating customer personalization and churn prediction as product features—complete with reproducible features, cost-aware decision rules, and governance checks—we turn predictive signals into repeatable retention and monetization levers that scale with confidence and measurable ROI.
Implementation Roadmap and ROI Metrics
Building on this foundation, the fastest path from pilot to sustained value is a phased roadmap that ties deployment stages to measurable ROI and clear operational gates. Start by aligning the target decision (what you will change) with a single business KPI—revenue, retention, MTTR, or inventory carrying cost—and declare a success threshold before touching data. That early clarity forces engineering choices that match latency, interpretability, and cost constraints for your AI analytics signal. When you scope this way, you avoid feature creep and make the first measurable release an executable business experiment.
Begin with a discovery phase that validates signal quality and defines the counterfactual, then run a compact pilot that focuses on integration rather than model novelty. During discovery we audit event lineage, label reliability, and cardinality issues so the pilot can reuse production-grade feature transforms from day one. In the pilot we deploy shadow inference and small randomized holdouts to measure causal lift while keeping risk low; after demonstrating measurable lift we harden pipelines for production. The productionization stage adds CI for features and models, canary rollouts, and automated rollback rules tied to business-metric degradation, and scaling follows once those gates consistently pass.
Operationalizing this requires MLOps primitives and a reproducible feature lifecycle: automated training pipelines, a versioned feature store, and lightweight inference services with tracing and rate limiting. We version feature transforms and model artifacts together so you can reproduce a prediction to a business outcome; that traceability is essential for audits and debugging. Put model-serving behind a policy layer that can evaluate expected-value rules instead of hard thresholds, and use canaries and shadow-mode scoring to validate both statistical and economic assumptions before wider rollout. Treat the feature store as the canonical serving source to prevent train/serve skew and to accelerate experiments.
How do you quantify ROI early without long A/B tests? Combine a short randomized holdout with backtesting and expected-value calculations derived from historical outcomes to get an early estimate. Define ROI as (Lift_in_business_metric * Unit_value – Total_costs) / Total_costs, where Total_costs includes engineering time, inference compute, and offer or execution costs. Use bootstrapped confidence intervals on lift and run sensitivity analyses on costs and adoption rates so stakeholders see worst-, base-, and best-case ROI scenarios before committing to scale.
Consider a concrete example to make these abstractions actionable: a churn-propensity pilot that reduces monthly churn by 1.5 percentage points for exposed users. If average lifetime value per user is $250 and the pilot treated 20,000 users with net lift of 300 retained customers, incremental revenue is 300 * $250 = $75,000. Subtract the pilot TCO—say $15,000 for engineering and cloud inference—gives net benefit of $60,000 and an ROI of 4x. That simple expected-value accounting ties model calibration, uplift measurement, and cost-per-action directly into investment decisions.
Instrument monitoring around both model-quality signals and business-impact KPIs so you catch degradation where it matters. Monitor calibration curves, uplift drift, feature missingness rates, and downstream KPIs (conversion lift, downtime avoided, fill-rate improvement) with alerts that escalate when business impact falls below the acceptance threshold. Automate retraining triggers when both statistical drift and business-metric decay cross predefined deltas, and require governance checks—privacy, explainability, fairness—before a model that fails those checks reaches production.
Finally, plan organizational adoption alongside technical scaling so the value compounds rather than erodes. Assign a measurable owner for each decision loop, instrument dashboards that show model-driven vs. baseline performance, and schedule quarterly ROI retrospectives that refresh cost assumptions and reprioritize signals. When you link feature-store hygiene, MLOps rigor, and business-metric accountability, the roadmap becomes a repeatable pipeline that turns AI analytics into predictable, auditable returns—and it prepares you to map specific architectures to use cases at scale.