Learn SQL and Python Basics (datacamp.com)
Building on this foundation, the next step is to get comfortable with SQL and Python basics, because these two tools show up again and again in data engineering work. SQL, or Structured Query Language, is the language you use to ask questions of a database, which is an organized place to store data. Python is a general-purpose programming language that helps you clean data, move it from one place to another, and automate repetitive tasks. If you are wondering, how do you learn SQL and Python basics without drowning in syntax? the answer is to treat them like two different skills that solve two different kinds of problems.
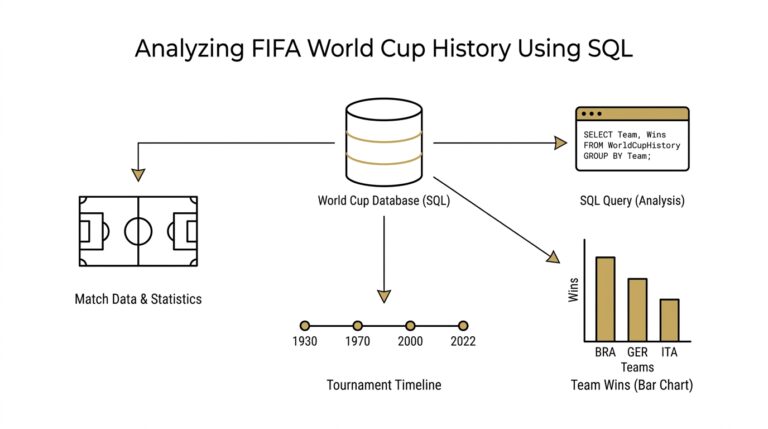
SQL is the place to start when you want to understand how data lives and breathes inside tables. A table is like a spreadsheet with rows and columns, where each row is one record and each column is one attribute, such as a customer name or an order date. With SQL, you learn to retrieve rows, filter them, sort them, and combine tables so the answers start to feel real instead of abstract. That is why SQL and Python basics matter so much: SQL teaches you how to talk to data, while Python teaches you how to work with data after you get it back.
The easiest way to make SQL feel familiar is to think in questions. Instead of memorizing commands in a vacuum, ask yourself what you would want to know from a business table: which orders came in yesterday, which products sell the most, or which customers have not returned in a while. Then you learn the SQL pieces that answer those questions, such as SELECT for choosing columns, WHERE for filtering rows, and JOIN for matching data from two tables. A JOIN is especially important because it lets you connect related tables, much like matching a customer list to an order list using a shared customer ID.
Once that clicks, Python becomes the friendly helper that takes the next step. Python lets you write a script, which is a small program that follows instructions from top to bottom, and that makes it useful for tasks like reading a file, cleaning messy text, or moving data from one system to another. You do not need to become a full software developer before you start; you only need enough Python to read code, write small loops, and understand variables, which are named containers that hold values. In practice, that means you can open a file, transform a few columns, and save the result without doing everything by hand.
A good beginner approach is to learn SQL and Python basics side by side, but not at the same speed. Spend time first on SQL because it gives you a direct view into how data is stored and queried, then use Python to automate or extend what SQL starts. For example, you might use SQL to pull a clean set of customer records from a database, then use Python to standardize names, remove duplicates, or prepare the data for a report. This back-and-forth is a lot like cooking: SQL gathers the ingredients, and Python helps you prep and combine them.
As you practice, focus on reading code before writing it from scratch. Try to understand what each line is doing, because that habit will save you from the kind of confusion that stops many beginners early. Start with small exercises, such as selecting columns from a table, filtering rows by date, or using Python to load a CSV file, which is a plain-text file format for tabular data. These small wins build confidence, and confidence matters when you are learning something that looks intimidating at first glance.
The real goal is not to memorize every command right away. It is to become the kind of learner who can look at a data task and say, “I know whether SQL or Python belongs here.” Once that decision becomes natural, the rest of your data engineering roadmap feels much less mysterious, because you are no longer staring at tools in the dark—you are beginning to see how they fit together.
Study Data Modeling Fundamentals (datacamp.com)
Building on this foundation, data modeling fundamentals are where raw tables start turning into a system you can reason about. If SQL helped you ask for data, modeling helps you decide how that data should live in the first place. In practice, data modeling is the habit of choosing what belongs in a table, how tables relate, and which fields identify each record. That matters in data engineering because a clearer structure makes querying, maintenance, and growth feel much less chaotic.
First, we meet two of the most important pieces in the story: the primary key and the foreign key. A primary key is a column, or a set of columns, that uniquely identifies each row in a table, while a foreign key points to a key in another table so the two tables can stay connected. Think of it like a library card number and a borrowing record: one identifies the person, and the other refers back to them without copying their details everywhere. Once that clicks, relationships between tables stop feeling mysterious and start feeling practical.
Now that we have the connectors, normalization enters the picture. Normalization is the process of organizing data into related tables so repeated information does not pile up in one place, and IBM notes that it uses primary and foreign keys to keep those smaller tables linked. That matters because duplication creates trouble: if the same customer detail appears in several rows, one update can be missed and the data starts disagreeing with itself. A beginner does not need to memorize every normal form right away; it is enough to ask, “Does this field belong here, or does it describe something that deserves its own table?”
This is where the two big modeling styles begin to feel different. A normalized model aims to reduce redundancy and keep each table focused, which is useful when you care about clean updates and careful data maintenance. A star schema, by contrast, places a fact table in the center and surrounds it with dimension tables, and Microsoft describes it as a mature approach for relational data warehouses because it works well for filtering, grouping, and summarizing. In plain language, normalization protects detail, while a star schema makes analysis feel more natural.
So what goes where? Dimension tables describe the business nouns in your story: products, customers, locations, and time. Fact tables store the measurable events: sales, clicks, shipments, or balances, along with the keys that connect each event back to its dimensions. If you have ever wondered how a dashboard can answer a question like which product sold best in which region last month, that is the star schema doing its job, because it lets the same event data be viewed from several angles.
How do you practice data modeling without getting lost? Start with one familiar process, like an online order, and sketch the nouns and verbs before you write any SQL. The nouns become candidates for tables, the verbs become relationships, and the repeated details become clues that a field belongs somewhere else. If a table starts to feel like a crowded backpack stuffed with unrelated facts, that is often your signal to split it and let foreign keys do the connecting. With that habit, data modeling fundamentals stop feeling abstract and start acting like a map you can use every time you build a pipeline or report.
Build ETL Pipelines (docs.aws.amazon.com)
Building on the foundation of SQL, Python, and data modeling, we can now watch the pieces start moving together. This is where ETL pipelines enter the story: ETL stands for extract, transform, load, and it describes the path data takes from its source to a place where people can trust and use it. If SQL helped you ask questions and modeling helped you decide where data should live, ETL pipelines are the roads that carry the data there. How do you build one when you are still new to the field? We start by understanding that the pipeline is not one giant task; it is a sequence of small, dependable steps.
The first step is extraction, which means pulling data out of a source system such as a database, an application, an API, or a file. Think of it like gathering ingredients before cooking: you are not changing them yet, only collecting them in one place. In practice, this stage often includes reading a CSV file, querying a table with SQL, or requesting data from an API, which is an application programming interface that lets one system talk to another. The important habit here is to keep the extraction process predictable, because if you cannot reliably get the data, everything that follows becomes fragile.
Once the data is in hand, transformation is where the real shaping begins. Transformation means cleaning, combining, standardizing, and checking the data so it matches the rules of the target system and the needs of the business. This is where your Python basics become especially useful, because Python scripts can rename columns, convert dates, remove duplicates, handle missing values, and merge multiple sources into a single view. Imagine receiving customer records where one file says “NY,” another says “New York,” and a third says “new york”; transformation is the stage where we choose one format and make the whole dataset speak the same language.
Before loading, it helps to ask one practical question: what does the destination expect? A well-designed target table, whether it is in a warehouse or a database, usually has a clear schema, which is the structure that defines columns, data types, and relationships. This is where data modeling pays off, because a pipeline works better when the destination already makes sense. If the target table expects one row per order, then the transformation stage should produce exactly that shape, with the right keys and fields in place. When people talk about building ETL pipelines, this alignment between source data and destination structure is what keeps the process from becoming a messy copy job.
Then comes loading, the moment when transformed data finally lands in the target system. Loading can mean inserting rows into a database, writing files into cloud storage, or refreshing a warehouse table that analysts will query later. At first glance, loading may sound like the easiest step, but it is where care matters most, because you want the data to arrive completely, accurately, and without duplication. A beginner-friendly way to think about this is to imagine unpacking boxes into labeled shelves: if the labels are wrong or the boxes are placed twice, the whole room becomes harder to trust.
As we discussed earlier, good engineering is not only about making something work once; it is about making it work again tomorrow. That is why ETL pipelines need checks, logs, and rerunnable steps. Checks tell you whether the data looks right, logs tell you what happened during each run, and rerunnable steps let you recover when a job fails halfway through. If you are wondering what separates a toy script from a real pipeline, reliability is one of the biggest answers, because a pipeline should behave like a steady routine rather than a one-time experiment.
So when you practice building ETL pipelines, start small and think in stages. Pull a simple dataset, transform one or two fields, load it into a target table, and then test whether the results still make sense after the next run. That habit teaches you the rhythm of real data work: extract with care, transform with intention, and load with confidence. Once that rhythm feels familiar, you will begin to see how every pipeline is really a story about moving raw data toward something cleaner, more useful, and ready for the next layer of analysis.
Explore Cloud Data Platforms (aws.amazon.com)
Building on SQL, Python, and data modeling, this is the moment when your work leaves the notebook and enters the cloud. A cloud data platform is the shared space where data gets stored, organized, queried, and protected so teams can use it without building everything from scratch. On AWS, that story often begins with Amazon S3, which acts as the storage foundation for a data lake, and then expands into services such as AWS Lake Formation, AWS Glue, Amazon Athena, and Amazon Redshift. The big idea is comforting once it clicks: you are not hunting for one magical tool, but learning how several services fit together like rooms in the same house.
So how do you know which platform belongs where? A helpful way to think about it is to separate the “place to keep data” from the “place to analyze data.” In AWS reference architectures, S3 is the data lake foundation, while analytics and governance services sit on top of it to make the data usable. AWS Glue helps you discover, prepare, move, and catalog data, which means it plays the role of a behind-the-scenes organizer rather than a visible destination. Lake Formation adds fine-grained access control, so you can decide who may see which tables, columns, or rows without turning permissions into a guessing game.
Once that foundation is in place, Amazon Athena feels like a very friendly first stop. Athena is an interactive query service that lets you use standard SQL to analyze data in S3 without copying it into a separate warehouse first, which makes it useful when you want quick answers or want to explore data before committing to a bigger structure. Think of it like opening a file cabinet and reading the labels directly instead of repacking every folder into a new system. For a beginner, this matters because it lowers the barrier to experimentation: you can practice writing queries, check assumptions, and get a feel for the data platform without managing much infrastructure.
From there, Amazon Redshift becomes the natural next character in the story. Redshift is AWS’s fully managed, petabyte-scale data warehouse service, and Redshift Serverless lets you analyze data without provisioning or managing the warehouse infrastructure yourself. That matters when your questions become more business-like and repeatable, such as dashboard refreshes, trend analysis, or multi-table reporting that needs consistent performance. If Athena feels like a flexible reading room, Redshift feels like a purpose-built analytics engine, designed for structured, high-performance querying at scale. AWS even frames Redshift Serverless as a way to start analyzing data in seconds, which is a good reminder that cloud platforms are meant to remove setup friction, not add it.
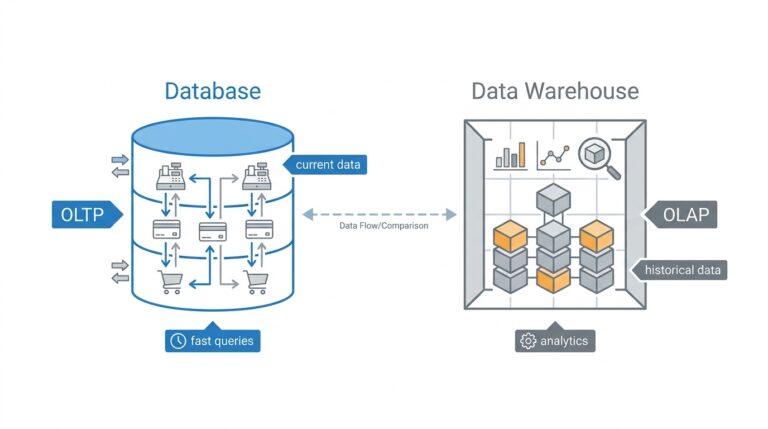
As we discussed earlier, modeling matters because your tables need a shape that matches the job they are meant to do. That same idea becomes more important in the cloud, where the platform choices affect how data is stored, queried, and shared. A data lake on S3 is often a flexible landing zone for raw and semi-structured data, while a data warehouse like Redshift is better suited to curated reporting and fast SQL analytics. AWS training for data engineering reflects this split by covering data lakes, data warehouses, batch pipelines, and streaming pipelines together, because real-world systems usually mix all four rather than choosing only one.
If you are learning from scratch, the smartest move is to explore cloud data platforms in the same order you would build them. Start by understanding how S3 stores data, then see how Glue catalogs and moves it, then try Athena for direct SQL queries, and finally look at Redshift when you need a more structured warehouse experience. How do you practice this without getting overwhelmed? Use one small dataset and follow it through the whole path, because watching the same data move across services makes the platform feel real instead of abstract. That is the point of this stage: not to memorize every AWS service, but to recognize how cloud data platforms turn raw files into something searchable, secure, and ready for analysis.
Master Workflow Orchestration (airflow.apache.org)
Imagine you have already built a clean ETL pipeline, and now the real question appears: how do you keep all those steps moving in the right order without babysitting them? That is where workflow orchestration comes in. In Airflow, orchestration means coordinating when tasks run, what depends on what, how failures are retried, and how you watch the whole process from a web UI. Airflow is built for batch-oriented workflows, defined in Python, and designed to help you schedule and monitor them instead of wiring everything together by hand.
The heart of this system is the DAG, or directed acyclic graph, which is a fancy way of saying “a set of steps with a one-way order.” Think of it like a recipe or an assembly line: you do not decorate the cake before you bake it, and you do not load downstream data before the upstream task finishes. In Airflow, a DAG collects tasks together and records their dependencies, so the platform knows the sequence, the timing, and the conditions for each run. Once that clicks, workflow orchestration stops feeling abstract and starts feeling like a map you can follow.
Now that the shape is clear, the scheduler is the part that keeps time. Airflow’s scheduler watches DAGs and task dependencies, then triggers task instances when the required conditions are met; for cron-style or timedelta schedules, it waits until the covered period has ended before starting the run. That design matters because it helps you work with complete data instead of data that is still arriving. It also explains why Airflow is so useful when you need reruns or backfills: you can process a missed day later, or rerun only the failed pieces instead of rebuilding everything from scratch.
The tasks inside a DAG usually arrive in three familiar forms. An operator is a reusable template for a predefined task, such as running a shell command or calling Python code; a sensor is a special kind of operator that waits for something to happen, like a file appearing or an external event arriving; and the TaskFlow API lets you write a Python function with the @task decorator and treat it as a task. Airflow also uses XComs, which are small cross-communication messages between tasks, to pass data along when needed. If you are asking, “How do I make Airflow feel less like configuration and more like code?” TaskFlow is often the friendliest answer.
Here is where workflow orchestration starts to feel practical. Suppose your pipeline waits for a raw file, cleans it, loads it into a warehouse table, and then sends a success notification. A sensor can hold the line until the file arrives, the transformation task can reshape the data, and the loading task can run only after the earlier steps succeed. Because the DAG records upstream and downstream relationships, Airflow knows the order automatically, and because each task is isolated, you can inspect logs and failures without guessing where the problem began. That is one of the quiet strengths of Airflow: the whole workflow becomes visible instead of hidden inside a giant script.
When you practice this skill, start small and think like a stage manager rather than a coder chasing features. Build one DAG with a few tasks, give each task a name that explains its job, and watch how the graph view changes as dependencies change. Then try a sensor, a retry, and a rerun so you can see how orchestration handles the real messiness of data work. The goal is not to memorize every Airflow feature on day one; it is to learn how to turn a pile of scripts into a dependable workflow orchestration system you can trust.
Practice with Real Data (datacamp.com)
Building on this foundation, practice with real data is where data engineering starts to feel alive instead of theoretical. The clean examples from earlier chapters still matter, but now you want to meet the imperfect stuff: missing values, odd timestamps, duplicated rows, and fields that do not quite match from one file to the next. DataCamp’s Understanding Data Engineering course leans into that idea with hands-on exercises built around Spotflix, a fictional music streaming company, where you collect, clean, and catalog data as part of the learning process.
So how do you practice with real data without getting overwhelmed? Start with one dataset and follow it all the way through the workflow, the way you might trace one package from pickup to delivery. That means opening the raw file, asking what each column represents, noticing what looks suspicious, and writing down the assumptions you make before you change anything. When you work with real-world datasets, that habit matters because the first version of the data is rarely the final version, and your job is to understand the gap between them.
At this stage, your goal is not to chase perfection; it is to learn how to read the shape of data. Use SQL to count rows, spot missing values, group by categories, and compare one slice of the dataset against another. Then bring in Python to standardize names, convert dates, trim text, or merge files that were never designed to fit neatly together. Think of SQL as your flashlight and Python as your workbench: one helps you inspect, and the other helps you reshape what you find.
If the dataset is too large for a local notebook, move the practice into a cloud-friendly environment so you can still explore it without copying everything around. Amazon Athena uses the AWS Glue Data Catalog to store metadata for data in Amazon S3, and Redshift Spectrum can query S3 files without first loading them into Redshift tables. That kind of setup is useful because it lets you practice data engineering on something closer to the real world, where data often lives in storage and gets queried where it already sits.
Once you have cleaned a dataset once, try doing it again from scratch. This second pass is where learning gets deeper, because you begin to notice which steps are repeatable and which ones were accidental. Maybe you realize that a field needs a stricter data type, which is the rule that tells a system what kind of values a column can hold, or that a join works only when customer IDs are normalized before the merge. These small discoveries are exactly what turn a one-time cleanup into real data engineering practice.
As we discussed earlier, real pipelines are not valuable because they run once; they are valuable because they can run again. When you eventually connect your practice dataset to scheduled jobs, Airflow’s scheduler monitors DAGs, which are directed acyclic graphs, and triggers task instances once their dependencies are complete. That is why this stage matters so much: you are not only learning how to clean data, you are learning how to build a steady habit around it, one dataset, one rerun, and one improvement at a time.