Pipeline Architecture Overview
Imagine you have a growing stream of sales, app events, and customer records arriving from different places at different speeds, and you need them to land in one trustworthy place without turning the whole system into a tangle. That is where data pipeline architecture earns its keep. It gives you the shape of the journey: where data enters, how it moves, where it gets cleaned, and where it finally becomes useful. When people ask, “How do modern data pipelines stay reliable as they grow?” the answer usually starts with the architecture, because the design decides whether the pipeline feels calm and predictable or fragile and chaotic.
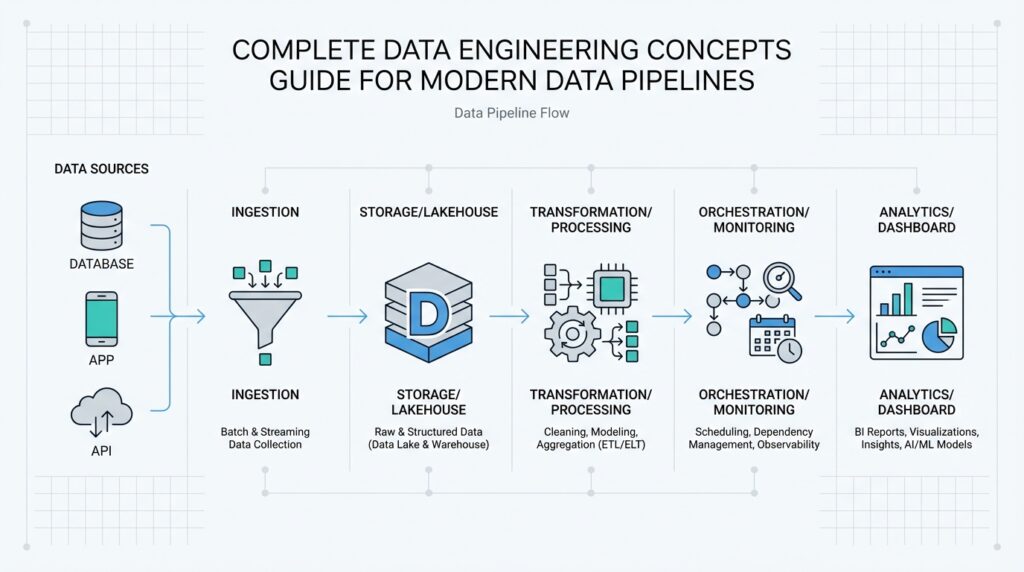
Building on this foundation, it helps to picture the pipeline as a small town with clear roads instead of a single crowded hallway. Data usually begins in source systems such as databases, application logs, or external APIs, which are the places where information is created. From there, an ingestion layer collects the data and passes it forward, much like a mailroom sorting incoming packages before anyone opens them. This is the first reason pipeline architecture matters: it separates collection from processing, so one busy source does not overwhelm everything else.
Once the data arrives, the next stop is often a transformation stage, where raw material becomes something readable and consistent. This is where we clean missing values, standardize formats, remove duplicates, and shape records so different systems can understand them. Think of it like preparing ingredients before cooking; you would not want to toss unwashed vegetables, unmeasured spices, and unopened cans into the same pot. In a modern data pipeline architecture, this stage can happen in batches, where data is processed at intervals, or in streams, where records are handled almost as soon as they appear.
Here is where it gets interesting. A good architecture does not only move data; it also protects it. That means adding validation checks, retry logic, logging, and alerting so the pipeline can notice when something goes wrong and tell you what happened. For example, if a source sends an unexpected date format, the system should not quietly keep going with bad data. It should flag the issue, preserve the broken record for review, and keep the rest of the flow moving if possible. This balance between speed and safety is one of the quiet strengths of well-designed modern data pipelines.
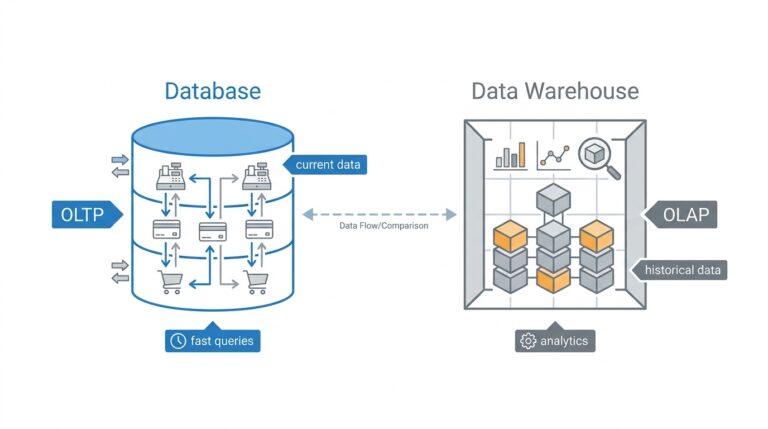
Storage and serving are the places where all that earlier work pays off. After transformation, data often lands in a warehouse, a lake, or another storage layer depending on how teams plan to query it and who needs access. A data warehouse is structured for analysis, while a data lake usually stores data in a more flexible, raw form. The architecture decides not only where data rests, but also how quickly people can find it, trust it, and use it for reporting, dashboards, machine learning, or product decisions.
Taking this concept further, orchestration brings the whole story together. Orchestration means coordinating tasks in the right order, at the right time, with the right dependencies, much like a conductor guiding different sections of an orchestra. Without orchestration, even a strong pipeline can become hard to manage because one task may start too early, another may fail silently, and a third may never run at all. With it, the pipeline architecture becomes easier to scale, easier to monitor, and easier to evolve as new data sources and new business needs appear.
That is why pipeline architecture is more than a technical diagram; it is the set of decisions that keeps the entire system understandable. When each layer has a clear role, you spend less time untangling failures and more time using the data itself. As we move forward, this structure gives us a reliable base for exploring how different pipeline components work together in practice.
Ingest Raw Source Data
Building on this foundation, the first real job of a modern data pipeline is to capture raw source data before anything has been polished, filtered, or rewritten. This is the moment when information leaves the source systems and enters the data ingestion flow, and it often feels a little messy at first, like opening a mailbox full of letters in different shapes, sizes, and languages. How do you bring all of that in without losing meaning? We start by preserving the data as it arrived, because that original form is often the most honest version of the story.
That is why the ingestion layer matters so much. It sits between the systems that produce data and the rest of the pipeline, acting like a careful receiving desk that records what came in, when it arrived, and where it came from. In practice, this may mean pulling records from databases, reading application logs, collecting files from cloud storage, or receiving events from an API, which is an application programming interface, or a structured way for software systems to talk to one another. At this stage, the goal is not to make the data pretty; the goal is to make it complete, traceable, and ready for the next step.
Now that we understand the role of the doorway, let us look at what can arrive through it. Raw source data can come in many forms, and each one brings its own rhythm. A customer database may send rows in batches, an app may emit clickstream events one by one, and a partner feed may drop a file every hour or every night. This variety is exactly why data ingestion needs careful handling, because each source system has its own pace, format, and failure patterns, and the pipeline has to respect all three.
Before we go further, it helps to know why teams often keep this data raw instead of transforming it immediately. Think of it like saving the ingredients before cooking the meal. If you chop everything too early, you may lose the shape of the original items and make it harder to recover from a mistake later. By storing raw source data first, we create a safety net: if a transformation rule changes, a bug appears, or a business question shifts, we still have the untouched input to revisit.
So what does that mean in practice? A solid ingestion process usually includes validation, timestamps, and metadata, which is data about the data, such as source, arrival time, and file type. It also needs retry handling, which means trying again when a request fails, because source systems and networks do not always behave perfectly. This is where the ingestion pipeline earns trust: it should accept good data, quarantine suspicious data, and log enough detail that you can trace problems without guessing.
Taking this concept further, the way you ingest data often depends on whether you want batch processing or streaming ingestion. Batch processing collects data over a period of time and moves it in groups, while streaming ingestion handles records as they appear, almost in real time. On one hand, batch jobs are easier to schedule and inspect; on the other hand, streaming can give teams fresher data for alerts, dashboards, and user-facing features. The right choice depends on how quickly the business needs the information and how much complexity the team is ready to manage.
When we bring all of this together, the key idea is simple: ingesting raw source data is about building a reliable entrance, not a perfect finish line. If the entrance is strong, the rest of the data engineering workflow has a much better chance of staying accurate, observable, and flexible. That is why this first stage deserves careful attention, because every clean dashboard, trusted report, and useful model begins with data that arrived safely and was handled with care.
Clean and Validate Records
Building on that raw landing zone, the next challenge is to turn messy records into something the rest of the pipeline can trust. This is where record cleaning and data validation work together: cleaning reshapes data so it is consistent, while validation checks whether each record makes sense before we let it move on. Think of it like sorting a stack of handwritten forms at a front desk. You are not rewriting the story yet, but you are checking that names are spelled consistently, dates look real, and the same person has not appeared three times under slightly different labels. In a modern data pipeline, this step protects everything that comes after it.
The first job is to look for the obvious friction points that appear when data arrives from different systems. One source may call the field customer_id, another may use id, and a third may leave the value blank when the record is incomplete. Record cleaning handles these differences by standardizing formats, trimming extra spaces, converting dates into one shared style, and removing duplicate rows that would otherwise distort reports. Why does this matter so much? Because a dashboard cannot tell the difference between a real spike in customers and the same customer being counted twice if the records were never cleaned in the first place.
Once the surface is consistent, data validation asks a more important question: does this record actually belong in the pipeline? Validation means applying rules that confirm the data fits expected limits, types, and relationships. A number should be a number, a shipment date should not appear before the order date, and an email field should at least resemble an email address. This is where data quality checks become practical rather than abstract. We are not trying to make the data look neat for its own sake; we are protecting the meaning of the record so that downstream systems do not build decisions on something broken.
Now that we understand the basic checks, it helps to see how teams handle records that fail them. A strong pipeline does not always delete bad data outright, because bad records can still be useful if they are inspected later. Instead, many teams route them to a quarantine area, which is a separate holding space for suspicious data, while logging the reason for the failure. That might be a missing required field, a value outside the allowed range, or a schema mismatch, which means the record no longer matches the structure the system expects. This approach keeps the data pipeline moving without pretending the problem never happened.
Taking this concept further, validation often happens in layers rather than all at once. Some checks run at ingestion time to catch broken files early, while others run after transformation to make sure the cleaned records still make sense in context. For example, an address field may pass a basic format check but still fail if the postal code does not match the country. That is why data validation is less like a single gate and more like a series of checkpoints on a long road. Each checkpoint removes a little more uncertainty, and each one gives you a better chance of trusting the final dataset.
When this part of the pipeline is handled well, the payoff shows up everywhere else. Reports stop disagreeing with each other, analysts spend less time hunting strange outliers, and machine learning models train on records that reflect reality more closely. Clean and validated records do not make the pipeline glamorous, but they make it dependable, and that dependability is what lets the next stages work with confidence.
Model Curated Data Layers
Building on the clean, validated records we just put in place, the next step is where data engineering starts to feel less like sorting mail and more like translating a language. A curated data layer takes trusted data and reshapes it into forms people can actually use for analytics, reporting, and decision-making. How do you turn rows of corrected records into something a business team can read at a glance? We model them. In practice, that means organizing data into business-friendly tables, naming things clearly, and setting up relationships so the dataset tells a coherent story instead of a pile of disconnected facts.
At this stage, the data pipeline stops asking, “Is this record valid?” and starts asking, “What does this record mean?” That shift is the heart of the curated layer. A customer order, for example, may begin as several separate records across systems, then become a single, recognizable view with the customer, product, date, region, and revenue all aligned. Think of it like arranging ingredients into a finished recipe card instead of leaving them on the counter in separate bowls. The raw material is still there underneath, but now it is shaped for the people who need to act on it.
Taking this concept further, data models often come in a few familiar forms. A fact table is a table that stores measurable events, such as purchases or page views, while a dimension table is a table that describes those events, such as customer details, product names, or locations. Together, they help teams answer questions like “What sold best last quarter?” or “Which region brought in the most revenue?” Some teams prefer wide tables, where useful fields live side by side in one place, while others use views, which are saved queries that present data without copying it. The right shape depends on how the team queries data and how much flexibility they need.
This is where model curated data layers become especially valuable. Instead of every analyst reinventing the same joins and filters, the curated layer gives everyone a shared version of the truth. That shared model reduces confusion, speeds up reporting, and keeps dashboards from drifting apart. It also makes data governance easier, where governance means the rules and practices that control who can see data, how it is defined, and how it is maintained. When you define metrics like “active customer” or “monthly recurring revenue” once in the curated layer, you lower the chance that different teams will calculate them in different ways.
Of course, a strong model is not only about shaping data for convenience. It also needs to preserve lineage, which is the trail showing where data came from and how it changed along the way. That trail matters when someone asks why a number shifted or why a report no longer matches expectations. If a field changes meaning, the curated data layer should make that change visible through documentation, versioning, and consistent naming. In a well-run data pipeline, the model does more than tidy up information; it protects trust by making the transformation logic explainable.
Imagine a subscription business trying to understand churn, which is the rate at which customers stop paying. The raw data might include billing events, product usage logs, and support tickets, all in different systems and formats. A curated model can bring those pieces together into a dataset that shows each customer’s subscription status, activity pattern, and renewal history in one place. That is the real power of this layer: it turns scattered signals into a business narrative. Once that narrative is clear, the next challenge is making sure it stays consistent as new data sources, new metrics, and new questions arrive.
Orchestrate Scheduled Workflows
Building on this foundation, the curated data layer still needs a heartbeat, and that heartbeat is orchestration of scheduled workflows. This is the part where we decide when each data job should run, what it depends on, and how the whole system should behave if one step is late or fails. How do you keep a pipeline running on schedule without babysitting it all day? We use workflow orchestration, which means coordinating tasks in a planned order so the right work happens at the right time.
A scheduled workflow usually starts with a trigger, which is the event or clock signal that tells the pipeline to begin. That trigger might fire every hour, every night, or after another job finishes, and orchestration tools help make those rules repeatable. Think of it like setting a series of alarms in a kitchen: one alarm says when to start chopping, another says when the oven should preheat, and a final one says when the meal should be checked. In the same way, data pipeline orchestration keeps each step moving in sequence instead of letting jobs start randomly and collide with each other.
Now that we have the basic rhythm, the next challenge is dependencies. A dependency is a task that must finish before another task can safely begin, and this is where scheduled workflows become much more than a simple timer. A daily sales report, for example, should wait until raw orders have landed, cleaned records have passed validation, and the curated model has been refreshed. Without that structure, the report may run too early and show incomplete numbers, which is why orchestration tools are so important in a real data platform.
Taking this concept further, reliable scheduling also means planning for the messy parts of operations. Sometimes a source system is late, a file arrives twice, or a network hiccup interrupts a run halfway through. Good workflow orchestration handles these moments with retries, which means trying the task again after a temporary failure, and with timeouts, which stop a task from hanging forever. It also helps if each task is idempotent, meaning it can run more than once without creating duplicate or corrupted results, because scheduled workflows often need that safety net when something is rerun.
This is where alerts and logs become part of the story, not an afterthought. Logs are the detailed records of what happened during a run, while alerts are the messages that tell a person something needs attention. If a scheduled workflow misses its expected finish time, the orchestration layer should say so clearly instead of hiding the problem until a dashboard looks wrong the next morning. That visibility turns workflow orchestration into a control room, where you can see failures, delays, and downstream impacts before they spread.
As we discussed earlier with curated data layers, the business does not only want data that is accurate; it wants data that is timely. A marketing team may need hourly campaign metrics, while finance may prefer a stable end-of-day close, and each one depends on a different schedule. That is why scheduled workflows are not one-size-fits-all. They let you match the pace of the pipeline to the pace of the business, whether you are refreshing dashboards, feeding machine learning features, or producing a month-end summary.
When this part is designed well, the pipeline feels less like a fragile chain of scripts and more like a reliable routine. You know what runs, when it runs, what must happen first, and what to check when something goes wrong. That clarity is the real value of orchestration tools: they turn scheduled workflows into a dependable system that keeps data moving, keeps teams informed, and keeps the next layer of analysis ready on time.
Monitor Quality and Governance
Building on the validation checks we already put in place, the next job is to keep watch after the data has moved on. This is where data quality monitoring and data governance become part of daily life, not one-time setup work. How do you know a pipeline is still trustworthy after it leaves the happy path? You watch for drift, keep the rules visible, and make sure the right people can explain what changed when something looks off.
Data quality monitoring is the practice of checking data as it flows and as it lands, so problems show up early instead of surprising the business later. Think of it like a smoke detector for your analytics stack: it does not prevent every issue, but it tells you when something needs attention. A good monitoring layer looks for freshness, volume, completeness, and unexpected shape changes, because a dataset can be technically present and still be wrong in practice. If yesterday’s order feed normally contains ten thousand rows and today it contains a few hundred, that is not a small detail; it is a signal.
Taking this concept further, the most useful checks are the ones that reflect how the data is actually used. A finance team may care about missing amounts, while a growth team may care about duplicate events or delayed arrivals, and both are reasonable. That is why data quality monitoring works best when it is tied to business meaning instead of abstract rules alone. A field can pass a format test and still fail the real test if, for example, every customer record suddenly reports the same country or every session starts at the same impossible timestamp.
This is also where data observability earns its place. Data observability means being able to see what the pipeline is doing, why it is behaving that way, and where the breakage started. Instead of waiting for someone to notice a dashboard looks strange, observability gives you logs, metrics, alerts, and lineage, which is the trail showing how data moved and transformed along the way. With that trail in hand, you can ask a better question: did the source change, did the transformation break, or did the warehouse load arrive late?
Governance adds another layer of safety by defining who can do what with the data and how those decisions are recorded. In practice, data governance includes access controls, which limit who can view or edit sensitive information, as well as ownership, stewardship, and policy enforcement. Think of it like the rules of a shared library: not every visitor can enter every room, and not every book should be handled the same way. When governance is clear, teams know which dataset is approved for reporting, which fields are sensitive, and who must approve a change before it reaches downstream users.
As we discussed earlier with curated data layers, shared definitions matter just as much as shared storage. Monitoring quality and governance means checking that those definitions stay stable over time, even when the pipeline grows and new teams start relying on it. A metric like “active customer” can drift if its logic changes quietly, and a permission model can weaken if a new dataset bypasses policy checks. That is why the best data governance programs pair documentation with automation, so policies are not buried in a handbook that nobody opens.
The practical goal is not perfection; it is fast visibility and disciplined response. When a check fails, the pipeline should tell you what broke, where it broke, and who should look at it next. That might mean alerting an owner, pausing a downstream report, or quarantining a suspicious dataset until the issue is resolved. With that steady watch in place, the pipeline stays trustworthy long after the first record is ingested, and the next stage can build on data that is not only clean, but continuously cared for.