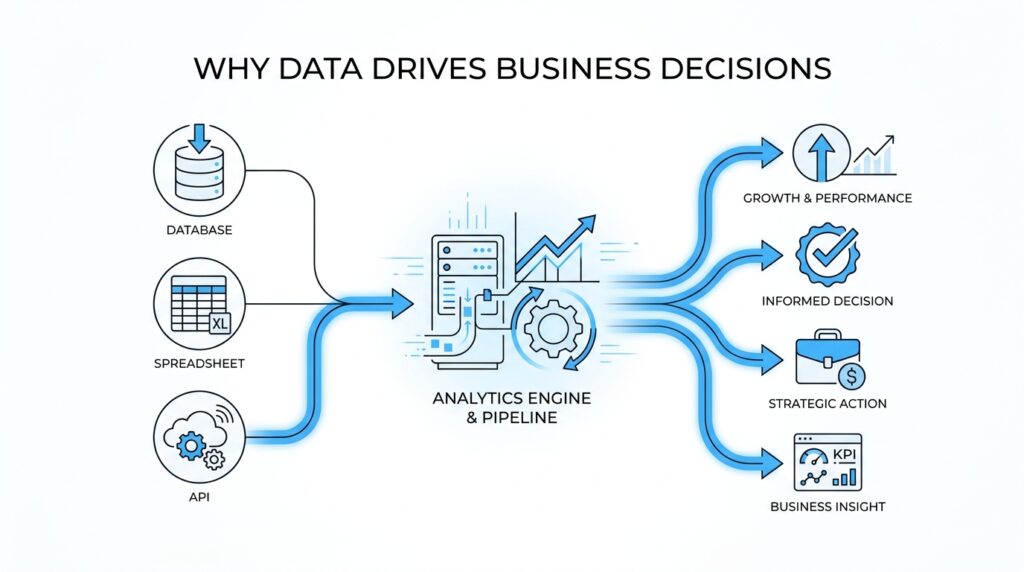
Start With Business Questions
Before anyone opens a dashboard or writes a query, the real work has already begun: we need to know what decision we are trying to make. That is the heart of data-driven decisions. A spreadsheet full of numbers can feel impressive, but without a clear business question, it is like gathering ingredients without knowing what meal you are cooking. The best analytics managers start by translating a messy concern into a question the business can actually answer.
If you have ever wondered, “How do we make data-driven decisions when there is so much data?” you are already asking the right kind of question. A business question is a plain-language problem the company needs solved, such as whether sales are slowing, whether customers are leaving, or whether a new campaign is working. This is where data analytics begins to earn its keep, because the question tells us what to look for and what not to waste time on. Without that focus, even a beautiful report can drift away from the decision it was supposed to support.
The next step is to turn that broad concern into something measurable. Here, a key performance indicator, or KPI, is a number that shows how well a business is doing at a specific goal, such as monthly revenue, churn rate, or average order value. That definition matters because business questions become useful only when they point to a metric we can track over time. If the question is, “Why did new customer sign-ups drop last week?” the answer will not come from a single number alone; it may require looking at traffic, conversion rates, and where people dropped off in the process.
This is also where many teams get tripped up. They start with the data they have, instead of the business question they need to answer. The difference is a bit like entering a store with no shopping list: you may leave with plenty of items, but not necessarily the ones that solve the problem. An analytics manager helps prevent that drift by keeping the conversation tied to the decision, not just the dataset. That discipline is what makes data-driven decision making feel practical instead of abstract.
Once the question is clear, we can make it testable. Testable means we can gather evidence that helps confirm, challenge, or refine what we think is happening. A hypothesis is just an educated guess, and in analytics it gives us a starting point: for example, “Sign-ups dropped because the checkout form became harder to use on mobile phones.” That guess is useful because it tells us where to look, what to compare, and what outcome would prove or disprove the idea.
Sometimes the most important work is narrowing a vague worry into a sharper question. “Customers seem unhappy” is hard to act on, but “Did return rates rise after the new checkout flow launched?” gives us a path forward. That shift matters because data-driven decisions depend on clarity more than volume. The better the question, the better the analysis, and the easier it becomes for leaders to trust the answer.
So, when we begin with business questions, we are not delaying the analysis; we are aiming it. We decide what the business needs, what success looks like, and which metric can tell the story without hiding the plot. From there, the rest of the analytics process has a direction, and the numbers can finally do the work they were meant to do.
Translate Goals Into KPIs
A goal like “improve customer retention” sounds clear until we have to decide whether it is working. That is where analytics turns into translation work: we take a broad business goal and reshape it into a KPI that tells the truth in numbers. If the goal is the destination, the KPI is the road sign that keeps us from wandering. In data-driven decisions, that translation matters because leaders cannot act on intention alone; they need a measurable signal they can trust.
The first move is to ask what change would prove the goal is happening. If we want better retention, are we looking for more repeat purchases, fewer cancellations, or a longer customer lifetime? Each answer points to a different KPI, and that choice changes the story the data will tell. This is why an analytics manager cannot treat every number as equally useful; the right metric has to match the business decision, not just the dashboard layout.
Once we have a likely KPI, we need to check whether it measures the outcome or the early warning signs. A lagging indicator is a result that shows up after the fact, like monthly churn rate or revenue. A leading indicator is an early signal that suggests where the outcome is heading, like trial-to-paid conversion or the number of support tickets after a product launch. The two work like a smoke alarm and a fire report: one warns us early, and the other confirms what happened.
That is where many teams start to feel the shape of the problem. A company goal can sound inspiring, but a KPI has to be specific enough that two people would measure it the same way. If “customer loyalty” is the goal, we might choose repeat purchase rate, renewal rate, or net promoter score, which is a survey-based measure of how likely customers are to recommend the company. The best choice depends on what the business actually wants to improve and what action it can take once the number moves.
We also need a baseline, which is the current starting point, and a target, which is the level we want to reach. Without both, a KPI floats in the air with no sense of direction. A 12% churn rate means very little on its own until we know whether last quarter was 18% and whether the team hopes to reach 9% by the end of the year. Data-driven decisions become easier when the numbers are anchored to a before and an after.
Here is the quiet skill behind good analytics: choosing KPIs that people can act on, not just admire. If a metric is too broad, it hides the path forward; if it is too narrow, it can pull attention away from the bigger goal. An analytics manager helps the team stay honest by asking, “If this number changes, what will we do differently?” That question keeps the KPI connected to business goals instead of turning it into decorative reporting.
When we translate goals into KPIs well, we give the business a shared language for progress. The conversation shifts from vague hope to measurable movement, and that makes data-driven decisions feel less like guesswork and more like steering. The number stops being a decoration on a slide and becomes a tool for action. From there, we can start asking which signals belong in the system and which ones are only noise.
Validate Data Quality and Lineage
Once we have a KPI in hand, the next question is not whether the chart looks polished but whether the numbers behind it deserve our trust. That is where data quality and lineage enter the story: data quality tells us whether the data is fit to use, and data lineage tells us where it came from, how it changed, and where it ended up. In practice, these two checks keep data-driven decisions from resting on a shaky foundation.
Data quality is bigger than catching a typo or deleting a duplicate row. It covers whether the data is accurate, complete, valid, consistent, unique, timely, and fit for the purpose we have in mind. That matters because a metric can be technically present and still be misleading if key records are missing, definitions drift across teams, or the data arrives too late to guide action. So when we ask, “Can we trust this number?” we are really asking whether the dataset meets the standard for the decision we want to make.
The easiest way to validate data quality is to trace the metric back to its source and inspect the rough edges along the way. We look for missing values, duplicate records, odd spikes, and mismatched definitions, because those are the places where a KPI can quietly lose its meaning. This is where data profiling, the process of reviewing and cleansing data to maintain quality standards, becomes useful: it helps us see what is present, what is broken, and what needs to be corrected before the result reaches a dashboard. If a conversion rate suddenly drops, we might discover that mobile events stopped recording for part of the day rather than that customers suddenly changed behavior.
How do we know the churn spike is real and not a tracking glitch? That is the kind of question data lineage helps answer. Lineage is the record of how data moves from raw sources through transformations and into final reports or products, so we can see which systems touched it and which steps altered it along the way. This matters because lineage supports troubleshooting, root-cause analysis, debugging, compliance, and impact analysis, especially when a small upstream change ripples into a very different-looking metric downstream.
Think of lineage as the receipt for a number. If a sales metric changes after a warehouse load, a filter rule, or a dashboard refresh, lineage shows the path we need to inspect instead of leaving the team to guess. That path also reveals dependencies between raw data and finished outputs, which makes it easier to understand what will break if a source system changes. In other words, lineage does not just explain the past; it helps us predict the blast radius of a change before it reaches decision-makers.
When we put data quality and lineage together, we get something much stronger than a clean spreadsheet. Quality tells us the data is reliable enough to use, while lineage tells us why it is reliable and where to look when it stops being reliable. For an analytics manager, that combination creates confidence without blind faith, because every important number can be checked, traced, and defended. It also helps the team speak the same language when a finding needs to move from analysis to action.
This is why the habit matters before any insight gets presented: first we verify the data, then we explain the result. A trustworthy report does not hide its history; it shows where the information came from, how it was shaped, and what caveats still remain. That discipline gives the next conversation a firmer footing, because once the team trusts the pipeline, it can spend its energy deciding what to do with the insight instead of arguing about where the numbers came from.
Design Dashboards for Action
Now that the numbers are trusted, the next job is to give them a place where people can actually use them. A dashboard for action is not a wall of charts; it is a working surface for data-driven decisions, built to answer the next question a manager, marketer, or operator is likely to ask. If you have ever wondered, what should a dashboard show first if you want people to act? the answer is: the few signals that change a decision, not the many metrics that merely describe the scenery.
This is where dashboard design starts to feel less like graphic design and more like coaching. We are helping someone move from “What is happening?” to “What should I do now?” That means every visual should earn its place by pointing toward a business decision, whether that decision is to pause a campaign, investigate a funnel drop, or push a successful product launch harder. A good dashboard does not try to impress; it tries to clarify.
The first thing we need is a clear audience, because different people need different kinds of help. An executive dashboard should read like a quick weather report, giving a fast view of the health of the business, while a team dashboard may need more detail so people can troubleshoot and respond. If we mix those audiences together, the dashboard becomes like a control room where everyone sees the same screen but nobody knows which button matters. An analytics manager protects against that confusion by designing for the decision-maker, not for the data warehouse.
From there, the layout should follow the flow of attention. The most important KPI, or key performance indicator, belongs where the eye lands first, usually near the top left, because people naturally start there. Supporting metrics should appear beneath it in a way that explains the main number, almost like stepping stones across a stream. This is one of the quiet truths of dashboard design for action: the viewer should never have to hunt for the story, because the story should already be arranged in front of them.
We also want every chart to answer a plain-language question. A line chart can show whether a number is rising or falling over time, a bar chart can compare categories, and a table can reveal the exact records behind a pattern. When we choose the wrong chart, we make the brain do extra work, and that slows down data-driven decisions. When we choose the right one, the dashboard feels less like a puzzle and more like a conversation.
Context is what turns a number into something usable. A metric without a target, threshold, or comparison point is like a speedometer with no speed limit beside it; you can see movement, but you cannot tell whether it matters. That is why strong dashboards include baselines, goals, and simple signals such as green, yellow, and red states, which tell the viewer whether to stay the course, watch closely, or intervene. For an analytics manager, this is the bridge between analysis and action.
The best dashboards also make room for explanation, not just display. Short annotations, date markers, and notes about major launches or outages help people avoid false conclusions when a number suddenly changes. This matters because even the cleanest data can look strange without context, and a good dashboard should help the team ask smarter questions instead of jumping to the wrong fix. In that sense, dashboard design is a form of guidance: it tells people what changed, why it may have changed, and where to look next.
Finally, actionability depends on what happens after someone sees the screen. A dashboard for action should make the next step obvious, whether that step is opening a drill-down view, assigning an investigation, or triggering an alert when a threshold breaks. When we build dashboards this way, data-driven decisions stop feeling abstract and start feeling operational. The numbers are still numbers, but now they behave like signals, and the team can move from looking to doing without losing the thread.
Apply Predictive and Prescriptive Analytics
Once the dashboard has told us what is happening, the next question feels more urgent: what happens next, and what should we do about it? This is where predictive analytics and prescriptive analytics enter the story, because they help us move from seeing the present to shaping the future. In data-driven decisions, that shift matters a lot. We are no longer staring at a number on a screen; we are trying to anticipate the next turn and choose the best path forward.
Predictive analytics means using historical data, which is data collected in the past, to estimate what is likely to happen next. A predictive model is the method we use to make that estimate, almost like a weather forecast for the business. If sales usually dip after a price increase, or if customers tend to churn after a poor support experience, predictive analytics helps us see the pattern before it becomes a surprise. This is where an analytics manager starts asking, “What does the trend suggest, and how confident are we?”
The beauty of predictive analytics is that it gives the team a working guess, not a crystal ball. It cannot remove uncertainty, but it can shrink the space of guesswork enough to make planning possible. A retailer might forecast next month’s demand, a subscription company might predict which users are at risk of canceling, and a marketing team might estimate which campaign is likely to convert best. Each of those predictions helps data-driven decisions become more grounded in evidence and less dependent on instinct alone.
But prediction is only half the journey. Prescriptive analytics goes one step further by asking what action makes the most sense given the prediction, the business goal, and the constraints, which are the limits we have to work within such as budget, staffing, or inventory. If predictive analytics says a customer is likely to leave, prescriptive analytics asks whether we should send a discount, route them to support, or do nothing because the cost would be too high. That is the difference between forecasting the road ahead and choosing the safest route.
How do we use predictive analytics in business without getting lost in the math? We start with a decision, then work backward to the signals that influence it. The prediction should connect to something a team can actually act on, like a replenishment order, a support outreach, or a pricing change. If the model cannot point toward a decision, it may be interesting, but it is not yet useful. Analytics managers keep this work honest by asking whether the prediction changes behavior or merely adds another number to the pile.
Prescriptive analytics depends on context, which is why it feels more human than mechanical. A recommendation is only useful when it respects the real-world situation around it. For example, a model might suggest offering a retention discount to every at-risk customer, but a prescriptive layer would test whether that idea is affordable, whether it fits policy, and whether a smaller intervention might work just as well. In that sense, prescriptive analytics is like a thoughtful advisor who knows the rules of the room, not just the math on the page.
This is also where scenario analysis becomes valuable. Scenario analysis means comparing a few possible futures so we can see how different choices might play out. One scenario might assume demand stays flat, another might assume a spike after a promotion, and a third might assume supply delays. By looking across those possible paths, the team can make data-driven decisions with a clearer sense of risk, trade-offs, and timing.
When predictive and prescriptive analytics work together, they give leaders both foresight and direction. Prediction tells us what is likely; prescription tells us what to do about it. That combination turns analytics from a reporting function into a decision engine, which is exactly why it matters so much under the hood. Once the business can trust not only what the data says, but also what the data recommends, the next step is to make sure those recommendations are delivered at the right moment and in the right workflow.
Run Experiments Before Scaling
Before we ask a team to roll a change out everywhere, we want to see it behave in a smaller, safer setting first. That is the real purpose of experimentation in data-driven decisions: we learn from a controlled test before we ask the business to bet big. Think of it like tasting the soup before serving the whole table. If the flavor is off, we can adjust the recipe without disappointing everyone at once.
This is where an experiment becomes more than a research exercise. An experiment is a structured way to compare two or more versions of something so we can see which one performs better under the same conditions. The most common version is A/B testing, which means showing one group the current experience and another group a new version. If you have ever wondered, “How do we know a change actually helped?” this is the kind of setup that gives us an honest answer.
The key is to start small enough to learn, but large enough to trust the result. We choose one clear question, one measurable outcome, and one change to test, because mixing too many variables turns the result into a foggy story. For example, if a checkout page feels slow, we might test a shorter form against the current one and measure completion rate. That keeps the analysis focused and helps an analytics manager avoid the trap of scaling an idea that only looked good in theory.
This step matters because early wins can be deceptive. A new feature might excite a few power users, but that does not mean it will work for the whole customer base. Experiments help us separate genuine improvement from a lucky spike, and they do it by giving us a comparison point. In data-driven decisions, that comparison is everything, because it shows whether the change moved the needle or simply added noise.
We also want to watch for the practical limits of the test itself. A result can look strong and still be too small, too short, or too uneven to trust. Maybe the test ran during a holiday week, or maybe one audience segment behaved differently than the rest. That is why analytics managers pay attention not only to the outcome, but also to the context around the outcome, so the business does not scale a pattern that only existed in a narrow slice of time.
Good experimentation also protects the team from overconfidence. A positive result tells us, “This is promising,” not, “We are done thinking.” What should you do when an experiment works? You check whether the effect holds across segments, whether it aligns with business goals, and whether the operational cost makes sense. That is the bridge between analysis and rollout, and it is where data-driven decisions become disciplined instead of impulsive.
Once a test has earned trust, scaling becomes a deliberate move instead of a leap of faith. We expand gradually, keep watching the same KPI, and make sure the win survives real-world pressure. That habit saves teams from expensive rollbacks and helps them build momentum on evidence rather than enthusiasm alone. In the end, running experiments before scaling gives the business a safer way to learn, a clearer way to choose, and a stronger foundation for the next decision.