Define AI Visibility Metrics
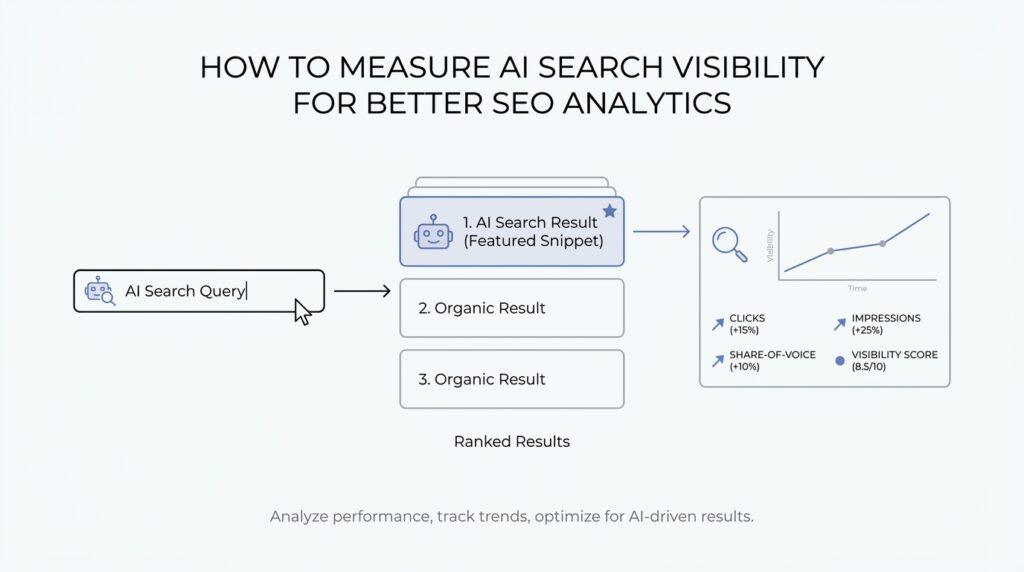
Before we can measure anything, we need a shared map of the terrain. AI visibility metrics are the numbers and signals that show how often your brand, content, or ideas appear inside AI-generated answers, and how clearly those answers point back to you. If traditional search engine optimization feels like checking where your shop appears on a busy street, AI search visibility is more like asking whether people can spot your name when a guide recommends places from memory. That shift matters, because the goal is no longer only ranking on a page of results; it is being present, useful, and recognizable inside the answer itself.
The easiest way to think about these metrics is to imagine a conversation happening around your brand. Some metrics tell us whether you were invited into the conversation at all, while others tell us whether you were introduced in a meaningful way. For example, an AI system might mention your company name, quote your content, cite your page, or send a reader to your site. Each of those signals tells a different part of the story, and together they create a fuller picture of AI search visibility than a single ranking number ever could.
That is why the first layer of measurement usually starts with presence. Presence means your brand appears in an AI answer at all, whether as a direct mention, a cited source, or a referenced recommendation. This is the most basic form of AI visibility metrics, and it answers the question: are we showing up when people ask about topics we care about? If the answer is no, we know the problem is not refinement but exposure, which is a very different kind of challenge.
From there, we move to prominence. Prominence describes how noticeable your appearance is once you are in the answer. Maybe your brand is mentioned first, maybe it appears alongside competitors, or maybe it is buried in a longer paragraph where few readers will notice it. In SEO analytics, this matters because being included is not the same as being influential. A brand that appears as the primary recommendation will usually gain more trust and attention than one that is mentioned as an afterthought.
The next layer is attribution, which means the AI system clearly connects the answer back to your content or site. Attribution can include citations, source links, or wording that makes it obvious where the information came from. This metric is especially important because AI search visibility is not only about being named; it is about being credited. When readers can trace an answer back to you, your content earns authority, and that authority can support both traffic and trust.
We also need to watch share of voice, a phrase that simply means how much of the visible conversation belongs to you compared with competitors. If five brands are likely to appear in answers about a topic, share of voice helps us see whether your brand is getting one spot out of five or three spots out of five. That kind of comparison turns raw visibility into something more strategic, because it shows where you lead, where you lag, and where a small improvement could create a meaningful jump.
Finally, good AI visibility metrics should connect back to business results. We want to know whether AI mentions lead to clicks, branded searches, newsletter signups, or other actions that matter to your goals. A metric is most useful when it helps you decide what to do next, not when it merely looks impressive on a dashboard. When we measure AI search visibility this way, we stop guessing about influence and start reading the pattern with more confidence, which gives us a stronger foundation for the next step in SEO analytics.
Track Mentions and Citations
Now that we know what to look for, the next question is where those signals actually live. Tracking mentions and citations in AI search visibility works a lot like keeping notes after a conversation: you do not need every word, but you do need enough detail to see patterns. If you are wondering, how do I track AI mentions in search answers without getting lost? the answer starts with consistency. We want to watch the same topics, the same prompts, and the same brands over time so the results tell a story instead of a one-day snapshot.
The first step is to create a small, steady set of prompts that represent the questions your audience would really ask. Think of these prompts as the doorways into the room where AI answers are happening. If you change the wording every time, the room changes too, and your measurements stop comparing like with like. By keeping a fixed prompt set, you can track when your brand appears, when a competitor appears instead, and when an AI system cites a source page directly. That gives you a clean view of AI search visibility instead of a noisy guess.
Once the prompts are in place, we can record each answer in a simple tracking sheet. A spreadsheet is just a digital table where rows store observations and columns store details, and it works well because it keeps the work visible. For each prompt, note the date, the AI tool or search surface, whether your brand was mentioned, whether your content was cited, and what URL or page was linked. Over time, those notes become more than records; they become evidence of how often your content is being recognized and whether attribution is getting stronger or weaker.
That is where the difference between mentions and citations starts to matter. A mention means the AI answer names your brand, product, or site, while a citation means it points back to your content as a source. Mentions can help with awareness, but citations usually carry more weight because they show clear attribution. When you track both together, you can see whether you are being talked about without credit or credited in a way that can send people back to you. That distinction is one of the clearest signals in AI search visibility, and it tells you whether your presence is growing in name only or in authority too.
As you collect more observations, look for patterns instead of isolated wins. A single citation can feel exciting, but what matters more is whether citations repeat across related prompts, whether they favor one page over another, and whether your brand appears beside the same competitors again and again. This is where share of voice becomes useful in practice, because you can compare how often you are mentioned or cited versus other names in the category. The goal is not perfection on every prompt; it is to understand where you consistently show up and where you keep disappearing.
It also helps to connect these notes to business outcomes, because not every mention has the same value. A citation that leads to a click, a branded search, or a contact form submission is more useful than one that sits quietly in an answer with no follow-through. So as we track mentions and citations, we should also ask what happened next. Did people visit the site? Did they search for the brand later? Did a specific page start getting more attention? Those downstream clues turn AI search visibility from a vague idea into something we can use to guide SEO decisions.
In the end, tracking mentions and citations is really about building a habit of observation. We are teaching ourselves to notice when AI systems notice us, and that awareness gives us a much steadier grip on SEO analytics. When the same pages keep earning citations, when the same topics keep surfacing, and when the same prompts keep producing your brand, we stop relying on guesswork. We start seeing which content is truly being carried into the answer, and that is the kind of signal that makes the next improvement much easier to plan.
Measure AI Share of Voice
By the time we reach AI share of voice, we are no longer asking whether your brand appears at all. We are asking how much of the conversation you actually own when AI systems answer the questions your audience cares about. That is a more useful question than it first sounds, because a single mention can feel encouraging while still hiding the fact that competitors are showing up more often, more clearly, or in better positions. If you have ever wondered, how do I measure AI share of voice in a way that means something?, the answer starts with comparison, not vanity.
The easiest way to picture it is to imagine a table where several brands are competing for the same seats. AI share of voice measures how often your brand gets a seat compared with the others in your category. If your brand appears in 18 out of 60 tracked answers, your share is much stronger than if it appears in 5 out of 60, even if both numbers look impressive in isolation. This is why AI share of voice matters so much in AI search visibility: it turns scattered appearances into a readable market signal.
To measure it well, we need to decide what counts as a meaningful appearance before we start counting. A mention is one kind of appearance, a citation is another, and a top-ranked recommendation is often the most valuable one of all. We do not want to treat every signal as equal, because an offhand name-drop is not the same as a cited source that guides the reader back to your site. So we build a simple scoring frame that reflects your goals, whether that means awareness, trust, or traffic from AI search visibility.
From there, the process becomes a little like keeping score during a long game. We use the same prompt set, the same competitor list, and the same AI surfaces so the comparison stays fair over time. Then we count how often each brand appears, how often it is cited, and where it shows up in the answer. This gives us a practical view of AI share of voice, not as a rough feeling but as a pattern we can track from week to week or month to month.
It helps to think about weighting the results, because not every appearance carries the same value. A brand that is mentioned once near the end of an answer may matter less than a brand that is cited first and linked directly. That is why many teams assign more weight to citations, prominent placements, or repeated appearances across related prompts. In SEO analytics, that kind of weighting turns raw counts into something closer to influence, which is the real prize behind AI share of voice.
Once we have the numbers, the story becomes much more interesting. We can see where a competitor dominates a topic cluster, where your brand holds steady, and where a small content improvement could shift the balance. Maybe one page earns citations consistently while another never appears, or maybe your brand wins in educational prompts but loses in comparison queries. Those patterns tell us where to invest next, and they make AI search visibility feel less mysterious and more manageable.
The final step is to connect share of voice back to action. If a topic drives citations but not clicks, we may need clearer calls to action or stronger page titles. If a competitor keeps winning the same prompts, we may need better coverage, fresher examples, or a more authoritative source page. When we measure AI share of voice this way, we are not collecting numbers for their own sake; we are learning where our brand earns attention, where it loses ground, and where the next SEO move is most likely to matter.
Compare Competitor Visibility
When we start comparing competitor visibility in AI search, the picture gets sharper fast. Up to this point, we have been learning how to spot our own mentions, citations, and share of voice, but now we add a second lens: who else is showing up beside us, and how often are they taking the spotlight? That comparison matters because AI search visibility is never happening in a vacuum. If a reader asks, how do I compare my AI search visibility to competitors?, the real answer is to watch the same prompts, the same topics, and the same answer surfaces while checking who appears, who gets cited, and who gets framed as the trusted choice.
This is where the work starts to feel more like a neighborhood survey than a simple tally. Imagine standing on a street corner and noticing which shops customers mention first when they ask for advice. One store may get named often, another may get cited as the expert, and a third may appear only when the conversation turns specific. Competitor visibility works the same way in AI search visibility: we are not only counting appearances, we are comparing patterns. That means we look at whether a competitor is mentioned more often, cited more clearly, or placed higher in the answer than your brand, because each of those signals tells a different story in SEO analytics.
To make the comparison fair, we need a stable frame. We use the same prompt set, the same AI tools or search surfaces, and the same category of questions for every brand we track. A prompt about beginner advice, for example, should be tested against the same competitor group each time, or the numbers will drift like a compass near a magnet. Once the frame is fixed, we can ask a clean question: across these prompts, does your brand appear more often, less often, or in similar positions to the competitors that matter most? That is the foundation of meaningful competitor visibility analysis.
The next step is to separate visibility into a few layers so we do not mix up very different outcomes. A mention means a brand name appears in the answer. A citation means the AI system points back to a source. A recommendation means the answer actively seems to favor one option over another. Those layers matter because a competitor can look weak on raw mentions but strong on citations, or the reverse. In AI search visibility, that difference helps us see whether a rival is winning attention, trust, or both, and it keeps our SEO analytics grounded in reality instead of guesswork.
Once we compare those layers side by side, useful patterns begin to emerge. Maybe one competitor dominates broad educational questions, while your site earns citations on narrower, higher-intent prompts. Maybe another brand appears less often overall but gets linked more consistently, which can make it disproportionately influential. Those details tell us where the market is leaning and where we still have room to move. Competitor visibility is not about copying what others do; it is about noticing where they are strong so we can decide whether to compete directly, specialize more deeply, or improve the pages that AI systems already trust.
It also helps to compare visibility by topic cluster instead of treating the whole category as one bucket. A competitor may be everywhere on comparison queries but almost invisible on how-to questions, while your brand may do the opposite. That kind of split is valuable because it shows us where the conversation is already favoring us and where we keep losing ground. When we read AI search visibility this way, we stop thinking in broad labels and start seeing opportunities in specific question types, which makes SEO analytics feel more actionable and much less abstract.
The most useful comparisons always lead to a decision. If a competitor keeps appearing with stronger citations, we may need clearer source pages, stronger evidence, or better-organized content. If another brand is mentioned often but rarely linked, we may be able to outrank them on trust by improving attribution and depth. And if your brand already matches competitors in some prompts, that is a sign of stability we can protect while pushing into weaker areas. Comparing competitor visibility, in the end, gives us a map of the contest around us, and that map is what helps us choose the next smart move instead of chasing every signal at once.
Map AI Traffic in Analytics
When we start mapping AI traffic in analytics, the scene changes from visibility to movement. We already know AI answers can mention us, cite us, and compare us, but now we want to see whether those moments lead people back to our site. That is the heart of AI traffic in analytics: tracing the visitors who arrive after interacting with an AI answer, then separating those visits from the rest of our search traffic. If you have been asking, how do I track AI traffic in analytics without guessing?, the answer begins with collecting evidence in the same careful way a detective follows footprints.
The first clue is the referrer, which means the page or system that sent the visitor to you. In a normal analytics report, a referrer can tell us whether someone came from a search engine, a social platform, or another website. AI traffic can be trickier because some AI surfaces pass clean referrer data while others do not, so we need to read the signs more than the label. That is why AI search visibility and AI traffic belong together: one tells us where we appear, and the other shows whether that appearance pulled a visitor into the next step.
From there, we look at the landing page, which is the first page a visitor sees after clicking through. This matters because AI-driven visitors often arrive with a very specific question already in mind, and the landing page tells us what answer they were looking for. If a page earns steady AI traffic but the session ends quickly, that may mean the page matched the question only halfway. If the same page keeps attracting longer sessions or deeper browsing, we have a stronger sign that the AI answer and the page content are working together.
To make the trail easier to follow, we often use UTM parameters, which are small tags added to a URL that help analytics tools identify where a click came from. Think of them like luggage tags on a suitcase: the page still arrives in the same place, but now we can see where it started. When we can control the link, UTM tags help us separate AI traffic from organic search traffic, especially in cases where a platform sends users without a clear referrer. Not every AI surface will let us tag the link, but when we can, those tags make the story much easier to read.
Once the traffic is labeled, we need to study the shape of the visit, not only the volume. A session is one visit window, and a conversion is a meaningful action such as a form fill, signup, or purchase. AI traffic in analytics becomes more useful when we compare sessions from AI sources with sessions from other channels, because the difference often shows intent. Maybe AI visitors spend less time but convert more often, or maybe they browse several pages before leaving. Either pattern can teach us something important about how AI search visibility influences real behavior.
This is where segmentation helps us think clearly. Segmentation means splitting data into smaller groups so we can compare them side by side, like putting puzzle pieces into separate trays before assembling the picture. We can segment AI traffic by landing page, topic cluster, device, or action taken after arrival. Then we can ask better questions: which prompts send the strongest visitors, which pages attract the most qualified clicks, and which AI answers seem to create curiosity instead of action? Those answers turn AI traffic in analytics from a vague trend into a practical guide for SEO decisions.
The best part of this mapping process is that it connects visibility to business value. When a page gains citations, we can watch whether traffic rises afterward; when a competitor outranks us in AI answers, we can see whether our clicks soften; when a topic starts earning more AI traffic, we can decide whether to expand it or improve the call to action. That is how AI traffic in analytics becomes more than a reporting exercise. It becomes a way to follow the path from answer to visit to outcome, which gives us a much clearer picture of what AI search visibility is really doing for the site.
Build a Reporting Dashboard
Now that we have a trail of mentions, citations, and traffic, the next step is to gather everything into a reporting dashboard—a single view that brings the most important numbers together in one place. A dashboard is like the control panel in a cockpit: it does not do the flying for us, but it helps us see what is happening fast enough to respond well. For AI search visibility and SEO analytics, that matters because the story lives across several signals, not just one chart. If you have been wondering, how do I build a reporting dashboard for AI search visibility that people will actually use?, the answer starts with choosing clarity over complexity.
The first job is to decide what the dashboard is for. A good dashboard should answer a few real questions, such as whether your brand is appearing in AI answers, whether those appearances are turning into clicks, and whether competitors are winning more often than you are. That focus keeps the report from becoming a junk drawer full of numbers. When we try to show everything, we end up seeing nothing clearly, so it helps to treat each panel as a sentence in the same story.
From there, we can organize the dashboard around the path we have already been tracking. One section can show presence, which tells us how often your brand appears at all. Another can show attribution, which tells us how often AI systems cite your content or point back to your site. A third can show share of voice, which compares your visibility with competitors, and a fourth can show AI traffic, which reveals whether those moments of visibility lead to real visits. Together, those pieces create a practical picture of AI search visibility instead of a pile of disconnected observations.
It also helps to keep the layout simple enough that a beginner can read it in a minute. Think of the top of the dashboard as the front porch: it should give us the most important view first. Put your clearest trend lines there, such as total mentions over time, citation count over time, and clicks from AI-driven visits over time. Then place supporting detail lower down, like the specific prompts, pages, or competitors behind those trends. That way, the dashboard starts with the big movement and only then invites us into the smaller clues.
A strong dashboard also needs a time frame. Reporting only on one week can make every change look dramatic, while reporting only on a year can hide useful shifts. Most teams get more value by comparing periods side by side, such as this month versus last month, or the last 30 days versus the previous 30 days. That comparison helps us answer a simple but powerful question: is AI search visibility improving, holding steady, or slipping? Without a time frame, even a beautiful dashboard can feel like a snapshot with no motion.
Once the core panels are in place, we should add context that makes the numbers easier to trust. A bare count of mentions can be misleading if one topic gets far more prompts than another, so the dashboard should label the prompt set, the AI surface, and the topic cluster each number comes from. In the same way, traffic should be tied to landing pages and conversions, which are meaningful actions like signups or contact requests. That context turns the dashboard from a scoreboard into a map, and maps are what help us make better SEO decisions.
The best dashboards also answer the next question before we ask it. If a competitor suddenly gains share of voice, we should be able to click into the prompts that caused the change. If a page earns citations but no traffic, we should be able to see whether the call to action is weak or the page is too broad. If one topic cluster keeps producing the strongest AI traffic, we should be able to spot it quickly and expand it with confidence. In other words, the dashboard should not only report what happened; it should point us toward what to do next.
As the dashboard matures, the goal is not to add more and more widgets. The goal is to make AI search visibility feel readable, repeatable, and useful. When the same view shows us mentions, citations, share of voice, competitor movement, and AI traffic in one place, we stop guessing where the opportunity is hiding. We start seeing which pages deserve more attention, which prompts deserve deeper coverage, and which gains are real enough to build on in the next round of SEO analytics.