Spot the Failure Symptoms Early
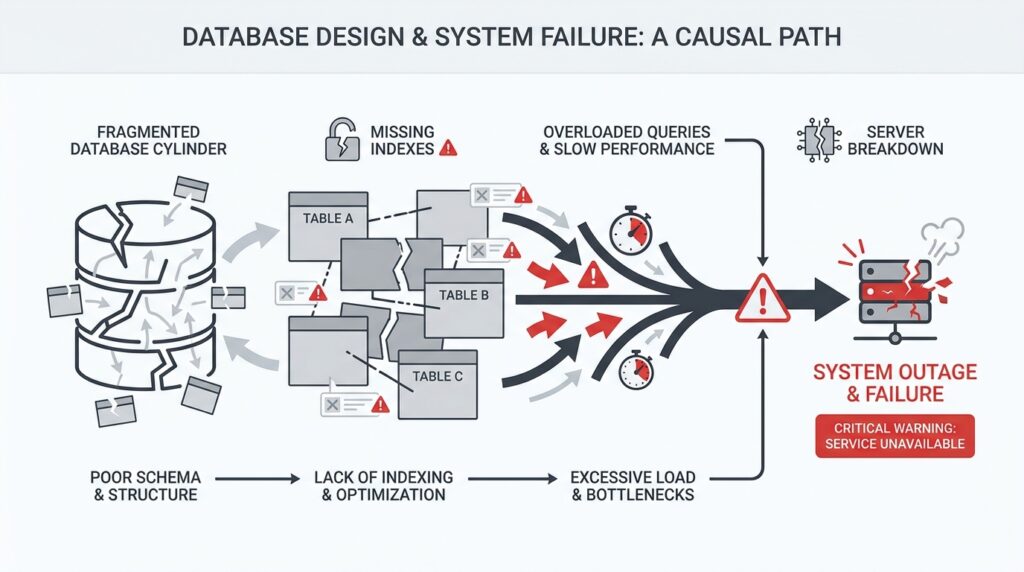
When database design decisions start going wrong, the warning signs usually appear long before a full outage. You might notice the app feeling sluggish, requests timing out, or one small change suddenly stressing everything else around it. If you have ever wondered, “Why is my database design causing timeouts even when the code looks fine?” you are already looking in the right place. The earliest failure symptoms are often quiet, and that makes them easy to miss until they grow into system failures.
The first clue is often latency, which means the time it takes for a request to get a response. At the beginning, it may look like a small delay: a dashboard loads a little slower, a search takes a few extra seconds, or a checkout step hesitates just long enough to feel off. Those little pauses matter because they reveal that the database is working harder than it should, often because the schema, indexes, or relationships force extra work on every query. In plain language, the database is walking a longer path than necessary.
Soon after that, you may see a strange pattern: the system works fine in quiet moments, then starts wobbling under normal traffic. That is a classic sign of lock contention, which happens when one request has to wait because another request is holding a piece of data “hostage” during a write. Think of it like several people trying to use the same narrow hallway at once. A database design that updates too many shared rows, keeps transactions open too long, or stores too much related activity in one place can turn that hallway into a traffic jam.
Another symptom is the slow drip of timeouts and retries. A timeout happens when an application gives up waiting for the database, and a retry is when it tries the same request again. The danger here is that retries can multiply the pressure instead of relieving it, which means one weak spot can start affecting unrelated parts of the system. If you are seeing repeated timeouts in a database design troubleshooting session, that is not just a performance annoyance; it is the system telling you that one design choice is now rippling outward.
You should also watch for rising error rates that seem to come and go with no obvious pattern. A query may run quickly on a tiny dataset, then slow to a crawl once the table grows, especially if the database has to scan many rows instead of jumping straight to the right ones. That is where indexing, which is a data structure that helps the database find records faster, becomes a major clue. When indexes are missing, poorly chosen, or ignored because of awkward query patterns, the database design is quietly turning everyday lookups into expensive searches.
Sometimes the symptom is not a single failure but a chain reaction. One overloaded primary database can slow down replicas, which are copies used for reading, and then the read traffic backs up too. One bloated table can make maintenance jobs run longer, which can interfere with other scheduled work. These are the moments when system failures stop feeling random and start looking connected, because the same structural weakness keeps surfacing in different forms.
The best habit is to treat these early warnings like smoke, not noise. If you see latency climbing, locks stacking up, timeouts repeating, or error rates rising after a schema change, pause and trace the pattern before the problem spreads. That is how you spot failure symptoms early and catch database design problems while they are still diagnosable, not catastrophic. The sooner we learn to read those signals, the sooner we can prevent a small design flaw from becoming a full system outage.
Find Schema Hotspots and Bottlenecks
Now that we can see the smoke, we need to find the flame. A schema hotspot is the place in your database design that every request seems to touch, while a bottleneck is the narrow point that slows everyone down once traffic arrives. Picture a hallway with one door that every person must use: even a well-built room becomes awkward when the door is too small. When you ask, Where is my database design getting stuck?, this is the moment to look for the busiest table, row, index, or partition first.
Start with the shape of the workload, not the code. If a single customer record, order row, or current-state table gets updated on every request, the schema can create a traffic jam even when each query looks harmless on its own. PostgreSQL’s partitioning docs note that performance improves when heavily accessed rows live in one partition or a small number of partitions, which is a clue that uneven access patterns create hot spots. When many sessions need the same object at the same time, lock waits become visible in pg_locks, and that is how a bottleneck begins to show itself.
This is where EXPLAIN becomes your flashlight. EXPLAIN shows the execution plan the database planner chooses, including whether it scans a table sequentially or uses an index, and which join strategy it picked. If a query that should fetch one customer instead walks the whole table, the schema is asking the database to do too much work for one simple question. In practice, that means the bottleneck is not the app being mysterious; it is the path to the row being too long.
Indexes often sit at the center of this detective work. PostgreSQL says indexes can find rows much faster, but they also add overhead to the system, so a design with too few indexes forces expensive scans while a design with too many can slow writes. A useful clue is whether the query can become an index-only scan, which can answer from the index alone without heap access, or a covering index, which stores extra columns for that exact purpose. If the access pattern and the index shape do not match, the schema bottleneck quietly returns.
Write-heavy hotspots deserve special suspicion because they often hide behind good read performance. A row that many transactions update can keep other transactions waiting, and PostgreSQL’s lock docs make clear that locks can be held until transaction end and that conflicting locks force waiting. That means a design that packs too much changing state into one row or one table can turn ordinary writes into a queue. The symptoms you saw earlier—latency, retries, timeouts—are often the shadow of that queue.
When the hotspot is structural, partitioning can soften it. PostgreSQL describes partitioning as splitting one large logical table into smaller physical pieces, and notes that query performance can improve when the heavily used rows sit in a small number of partitions because those indexes are smaller and more likely to stay in memory. Partition pruning then skips partitions that cannot contain matching rows, so the database does less wandering and more direct work. In other words, we are not only chasing a slow query; we are reshaping the schema so the database has fewer crowded hallways to walk through.
Fix Missing and Misused Indexes
After we’ve found the hotspot, the next question is sharper: are we missing an index entirely, or are we using the wrong one? That is where database design starts to feel less like architecture and more like a map of footpaths, because every query wants the fastest route to its rows. PostgreSQL recommends using EXPLAIN to see the plan the planner chooses, and it also reminds us to run ANALYZE so those choices are based on real table statistics. In other words, before we fix missing indexes or misused indexes, we need to see the path the database is actually taking.
A missing index usually shows up as a sequential scan, which means the database is walking through rows one by one instead of jumping straight to the match. That is fine for tiny tables, but it becomes expensive when a query keeps asking the same question on a growing table, such as filtering by customer, status, or created-at time. PostgreSQL’s documentation is clear that indexes let it find specific rows much faster, but they also add overhead to the system as a whole, so the trick is to place them where they remove the most work. If you are asking, “Why is this one lookup slow when the code looks fine?”, a missing index is often the first place to look.
A misused index is a different kind of trap. The index exists, but its shape does not match the query, so the planner cannot use it as efficiently as we hoped. With multicolumn indexes, PostgreSQL can use the leftmost columns first, and then continue to columns on the right without gaps; it also relies on the right kind of conditions, usually AND-connected filters. That means an index on (a, b, c) can help a query on a or a, b, but a query that skips b or leans on OR may leave the index sitting idle.
This is why column order matters so much in database design. A composite index, which is just an index on more than one column, should usually mirror the way the query narrows the search, not the way the table happens to look on paper. Partial indexes, which index only the rows that match a condition, can be a smart fix when most rows are irrelevant to the query, but PostgreSQL will only use them when the query’s WHERE clause logically implies the index predicate. So if the filter in your app does not line up with the filter in the index, the index can exist and still miss the moment it was meant for.
Sometimes the best repair is not a bigger index, but a narrower one. PostgreSQL supports index-only scans, which can answer a query from the index alone when the needed columns are already there, and a covering index is an index built for exactly that purpose. This helps most when you keep reading the same data and the table rows do not change constantly, because then the database can avoid extra heap access. It is a good example of fixing misused indexes by reshaping them around the actual query pattern instead of stuffing every column into every index.
We also have to talk about the quiet cost of too many indexes. PostgreSQL says indexes speed up reads, but they add overhead to the database system, and even index builds themselves can slow other operations because they consume extra CPU and I/O. That is why a database design with duplicate, unused, or nearly identical indexes can make write-heavy workloads feel heavier than they should. If an index never appears in the real query plans, that is a strong hint it may be dead weight rather than help.
The safest way forward is to treat indexes like tools you place one by one, not decorations you scatter everywhere. Start with the slowest real queries, read the plan, and ask whether the database is missing a path, following the wrong path, or carrying extra baggage. Then add the smallest index that matches the access pattern, verify that EXPLAIN starts showing the plan you expected, and keep checking that the index still earns its place as the workload changes. That is how we fix missing indexes and misused indexes without turning one problem into another.
Reduce Locking and Transaction Contention
Why does one update freeze everything else? Usually, we are looking at a lock that has stayed in place too long, and at transactions that keep asking for the same piece of data at the same time. A lock is the database’s reservation sign for shared data, and transaction contention is the waiting that begins when too many transactions reach for that sign together. In PostgreSQL, row-level locks block other writers to the same row, and transaction-level locks are released at the end of the transaction, so the question is not only what we lock but how long we keep the transaction open.
That is why short transactions matter so much. If we open a transaction, do the write, and commit quickly, we clear the hallway sooner and let the next request through; if we leave the transaction open while waiting on user input or extra application work, PostgreSQL may keep other work waiting for a very long time. The safest pattern is to keep the critical section small so only the real database change lives inside the transaction, while slow steps like network calls, file work, or human approval happen outside it.
Deadlocks are the dramatic version of the same problem. They happen when transaction A holds one lock and wants another that transaction B already holds, while transaction B wants the first one; PostgreSQL can detect that cycle and abort one of the transactions, but we can avoid the mess by acquiring locks in a consistent order every time. When we update rows in the same order across the application, we remove the circular wait that turns busy traffic into a standstill.
When one larger transaction contains several smaller steps, savepoints give us a way to keep the work under control. A savepoint is a marker inside a transaction that lets us roll back part of the work without discarding everything, and RELEASE SAVEPOINT frees those resources earlier than the end of the transaction. That helps when a sub-step may fail, but it is not a reason to keep one oversized transaction alive; the real goal is still to reduce the amount of time we hold locks.
Sometimes the contention is not a coding mistake so much as a design signal. If every request is fighting over the same hot row or shared state record, we may need to split that state into smaller records, move history out of the write path, or use transaction-level advisory locks only when the application needs a named business-level reservation. PostgreSQL notes that advisory locks are released automatically at transaction end and can avoid some of the bloat of table-based flag locking, which makes them a useful escape hatch when ordinary row locks are the wrong tool. The practical test is simple: if every request is still lining up behind the same door, we have not reduced locking and transaction contention enough yet.
Revisit Normalization and Data Duplication
After we trace hotspots, locks, and slow queries, the next question usually feels more basic: are we storing the same fact too many times? This is where database design, normalization, and data duplication start to matter in a very practical way. Normalization means arranging data so each fact lives in the right place, usually once, while data duplication means the same information is copied into multiple rows or tables. If you have ever wondered, “Why is my database design causing timeouts even though the code looks fine?”, the answer is often hiding in how much repeated data the schema carries around.
Normalization is one of those ideas that sounds abstract until you picture a cluttered desk. If every note exists in three different notebooks, you spend more time checking which version is correct than doing the work in front of you. A normalized schema tries to avoid that by separating distinct facts into their own tables and connecting them with keys, which are the fields the database uses to link related records. That structure makes updates safer, because when a customer changes their email address, we change it in one place instead of chasing copies across the system.
That reduction in repetition is not just neatness; it is protection. Every duplicate value creates another chance for the data to drift apart, which means one screen may show an old address while another shows the new one. In a busy system, that inconsistency becomes a failure symptom of its own, because the application starts making decisions from slightly different versions of the truth. When you revisit normalization and data duplication together, you are really asking whether the schema is helping the database stay accurate under pressure or making it easier to lie to itself.
At the same time, we should not confuse normalization with perfection. A fully normalized design can sometimes ask the database to join many tables together, and a join is the operation that combines rows from related tables into one result. That is not automatically a problem, but it can become one when a high-traffic query has to stitch together the same relationship over and over again. So the real question is not, “Should we duplicate anything at all?” but, “Which repetition is serving performance, and which repetition is creating risk?”
This is where deliberate duplication enters the story. Sometimes we keep a small copied value on purpose, such as a customer name on an order record, because it helps us display history exactly as it was at the moment of purchase. That kind of data duplication can be useful when the system needs a snapshot, but it should be a conscious choice, not an accident of design. If the duplicated value is meant to stay in sync, then every write must update every copy, and that extra work can slow transactions, increase lock time, and widen the window for errors.
A healthy database design usually finds a middle path. We normalize the pieces that must remain authoritative, then duplicate only the fields that clearly reduce expensive joins or preserve historical meaning. This is why schema design feels like balancing on a narrow bridge: too much duplication and the truth fragments, too much normalization and every request may have to assemble a puzzle before it can answer. The goal is not to choose one side forever, but to decide which shape best fits the way your data actually moves.
If you are reviewing an existing system, start by looking for repeated fields that should have one owner. Ask which table should be the source of truth, which copies are historical, and which copies are only there because nobody ever cleaned them up. Then look at the write path and the read path together, because duplication often looks harmless during reads but becomes expensive the moment updates begin. That small check can reveal whether normalization is strong enough, or whether data duplication has quietly become one more reason the system feels fragile.
When we step back, this part of the design tells a bigger story than storage alone. A well-normalized schema lowers inconsistency, and carefully chosen duplication can lower query cost, but careless duplication does the opposite and turns ordinary traffic into extra work. That is why the most reliable database design decisions come from treating each repeated value as a tradeoff, not an accident, before we move on to the next pressure point in the system.
Test Recovery Under Real Load
When the system is already busy, a recovery plan stops being a document and starts behaving like a survival drill. This is why testing recovery under real load matters: a database can look healthy in a quiet restore test and still stumble the moment live traffic, retries, and background jobs arrive at once. If you have ever asked, how do we know our database recovery testing will hold up during an actual outage?, that is the right question to ask before the outage teaches it for us.
The scene is usually familiar. A backup restore test works in staging, the data comes back, and everyone feels reassured. But staging is like rehearsing in an empty theater, while production is the crowded show with people moving, phones ringing, and doors opening all at once. Real load changes everything, because recovery is not only about getting the database running again; it is about getting it running while the rest of the application is still pushing, waiting, and reconnecting.
That is where the core recovery targets come in. Recovery time objective, or RTO, is the maximum time we can afford to be down, and recovery point objective, or RPO, is the maximum amount of data we can afford to lose. Those numbers sound neat on paper, but they only mean something if we test them against real workload patterns. A recovery that meets RTO in a calm lab can still fail in practice if connection storms, lock buildup, or replay delays slow everything down.
So we test the whole path, not just the backup file. We want to see how fast the data restores, how long index rebuilds take, how the application behaves while connections come back, and whether replicas can take over without creating a second outage. This is the part of database recovery testing that reveals hidden strain, because a restore is like rebuilding a bridge while cars are already trying to cross it. The database may recover cleanly, but the surrounding system can still buckle if we have not planned for the traffic.
One of the most revealing moments is the first minute after failover, which means switching work from a failed primary database to another server that can take over. In a real incident, traffic rarely pauses politely. Clients retry requests, background workers wake up, and cached assumptions about the old primary may still be floating around, so we need to watch for thundering herd behavior, which is a rush of many clients hitting the same recovering service at once. If our recovery plan only works when traffic is paused, it is not really a recovery plan; it is a demo.
The best test includes the awkward details people often forget. We should try restoring from the backup type we actually rely on, not the one we wish we had, and we should restore into an environment that looks enough like production to expose timing problems. Then we keep the workload alive during the exercise so we can see how queries, locks, and write queues behave while the database is still warming up. That is how backup restore testing becomes useful: it stops being a box-checking exercise and starts showing us where the system slows down under pressure.
We also learn a lot by watching what happens after the database is technically back online. Are old connections still pointing at the failed node? Do readers surge toward a replica that is not fully caught up? Does the application produce errors because it assumes recovery happened instantly? These are the small cracks that only show up under real load, and they often explain why a database design that seemed resilient on paper still produced a messy outage.
The payoff is not confidence in the abstract; it is confidence in a specific sequence. We know which step takes the longest, which step needs automation, and which step needs the application to wait a little longer before flooding the recovered system. That is the real value of testing recovery under real load: it turns hidden fragility into something we can measure, fix, and test again before the next incident arrives.