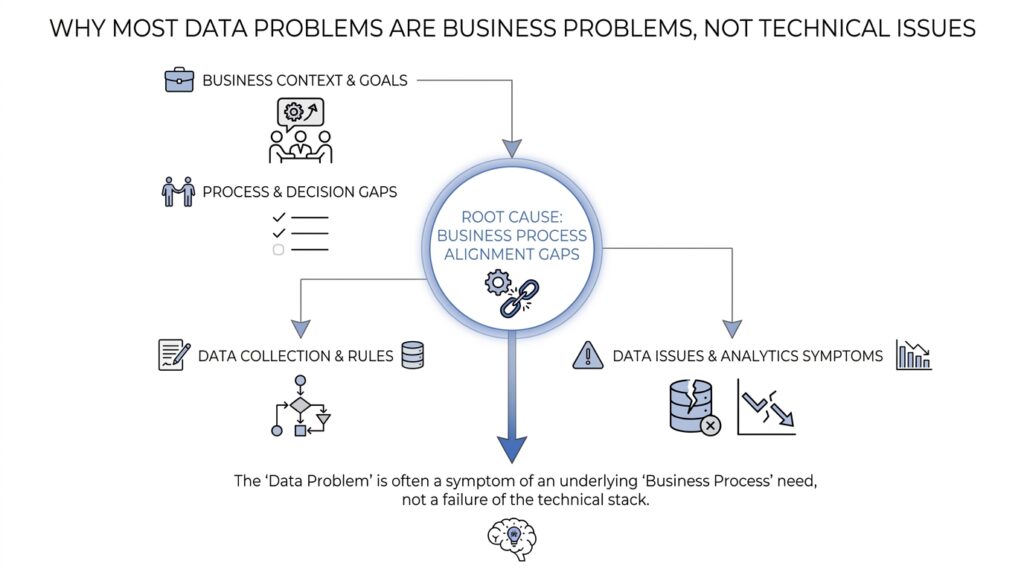
Spot Business Symptoms First
When a dashboard looks wrong, our first instinct is often to blame the data pipeline, the warehouse, or the latest script someone changed on Friday afternoon. But the faster move is to ask a more human question: what business problem is showing up first? In practice, most data problems announce themselves as business symptoms before they ever look technical. A sales team misses its target, finance cannot match two reports, support tickets start piling up, or a leader says, “Something feels off.” That is the moment to slow down and listen, because the symptom usually tells us where the pain lives.
Think of it like noticing a cough before naming the illness. The cough is real, but it is not the whole story, and it does not tell us whether the problem started in the lungs, the throat, or somewhere else entirely. Business symptoms work the same way. If a weekly revenue report suddenly drops, the real issue might be a broken data feed, but it might also be a pricing change, a sales process shift, or a product launch that never got communicated to the analytics team. When we start with the symptom, we keep the problem anchored in the world the business actually cares about.
So what does a business symptom look like in everyday work? It is anything people can feel, see, or act on, even if they cannot yet explain why. A customer churn rate climbs. Inventory looks fine in one system and empty in another. A manager spends an hour every morning reconciling spreadsheets because no one trusts the numbers. These are not abstract data issues; they are business problems that happen to have a data trail attached. And that distinction matters, because if we only chase the broken table or the failed job, we may miss the operational cost the organization is paying every day.
This is why the first good question is rarely, “Which tool failed?” It is more often, “Who noticed this first, and what changed for them?” That question pulls us toward the impact instead of the mechanism. If finance spots a mismatch, we learn how the error affects close timing, forecasting, or compliance. If a customer success team reports confusion, we learn whether the issue is hurting retention, renewals, or trust. Once we understand the business symptoms, we can trace the data problem with better focus, because we know what outcome needs to be protected.
A helpful way to think about this is to separate signals from causes. A signal is the visible effect: late reports, duplicate records, missing orders, conflicting metrics. A cause is the hidden reason behind it: a bad join, a stale mapping, an upstream system change, or a process gap in how data gets entered. When teams skip the signal and jump straight to the cause, they often optimize the wrong thing. When they start with the signal, they can test their way back to the root cause in a calmer, more deliberate way.
You may be wondering, “How do I spot a business symptom quickly when everything looks like a data issue?” The answer is to look for friction in decisions, not only in tables. If people are delaying a launch, rechecking numbers by hand, or arguing over which dashboard to trust, that friction is the business symptom. It tells us the organization is spending time, money, or confidence because the information flow is not supporting the work. That is the real story, and it is usually the best place to begin.
Once we name the symptom clearly, the next step becomes much easier. We can ask what changed, which process depends on the affected data, and how the issue shows up across teams. That keeps us from treating every data problem like a pure engineering puzzle. More importantly, it reminds us that the goal is not to make the system look tidy; it is to help the business move with confidence when the numbers matter most.
Trace The Process Gaps
Once we have the symptom in hand, the trail usually leads away from the dashboard and into the day-to-day business process. This is where process gaps start to matter, because many data problems begin when people, systems, or teams do not hand work to each other cleanly. In other words, the data may look broken, but the real crack often sits in the workflow that created it. If you have ever asked, “Where did this number come from?” you are already standing at the edge of the gap.
A process gap is the missing step, unclear rule, or inconsistent habit that lets information slip through the cracks. It can be as ordinary as a sales rep entering a deal late, a support agent choosing the wrong category, or an operations team updating a spreadsheet after the official report already ran. None of these moments look dramatic on their own, which is why they are easy to miss. But together, they create the kind of data problem that keeps coming back, no matter how carefully we fix the report.
The key is to trace the process from start to finish as if we were following a package through a warehouse. We do not begin by blaming the shelf where the box ended up; we watch every handoff, every label, and every stop along the route. Who creates the record? Who checks it? When does it move into another system? Which team depends on it next? Once you walk the business process in order, the weak spots usually reveal themselves, and the data problem becomes much less mysterious.
This step matters because a process gap often hides behind a technical-looking failure. A missing field might be caused by a form that asks too much at the wrong moment. A duplicate customer record might come from two teams using different naming habits. A late KPI might not be a warehouse issue at all; it might be the result of a report that depends on a manual approval someone forgot to send. When we trace the process gap, we stop treating the data problem as isolated and start seeing the human routine underneath it.
So how do we trace the process without getting lost in details? We start with the handoff points, because that is where most business process problems show up. Every time work moves from one person, team, or system to another, there is a chance for delay, confusion, or re-entry. That could mean a customer order moving from sales to finance, a lead moving from marketing to the CRM, or a return moving from support to operations. If the same problem keeps appearing, the gap is often sitting right at one of those handoff points.
It also helps to ask what the process assumes will happen, not just what appears in the system. Many business data problems come from silent assumptions: that someone will always fill in a field, that a team will always update a status, or that two systems will always use the same definition. Those assumptions feel harmless until reality disagrees. Then we get missing data, conflicting reports, and endless reconciliation work. By naming the assumption, we expose the part of the process that never had a real safeguard.
As we trace the process gap, we should also pay attention to exceptions, because exceptions tell the truth about how work really runs. The “normal” path may look tidy in a diagram, but the everyday path often includes shortcuts, rush jobs, and manual fixes. If a team keeps building side spreadsheets, sending updates over chat, or copying numbers from one tool into another, that is not noise; it is evidence. The business process has already adapted, and the data problem is usually following that adaptation instead of causing it.
When we think this way, the investigation becomes more useful and more humane. We are no longer asking people to defend a broken report; we are learning how their work actually moves. That shift helps us trace the process gaps that create repeat data problems, and it gives us a better chance of fixing the real source instead of cleaning up the same mess again tomorrow.
Clarify Data Ownership
Once we have traced the process gap, the next question is the one that quietly decides whether the fix will stick: who owns this data? That question sounds administrative, but it is really about accountability, decision rights, and follow-through. If no one knows who is responsible for a dataset, a metric, or a recurring report, then every correction becomes a temporary patch instead of a lasting improvement. In practice, clear data ownership is what turns a messy business symptom into a problem someone can actually solve.
This is where many teams get stuck, because they assume ownership means “the analytics team owns the numbers” or “IT owns the system.” But a system owner, which is the person or team responsible for the tool itself, is not the same as a business owner, which is the person accountable for what the data means and how it gets used. A data steward is someone who helps keep definitions, quality rules, and day-to-day practices consistent, but stewardship is not the same thing as final accountability. When those roles blur together, the organization starts asking the wrong people to make the right decisions.
The easiest way to see the problem is to imagine a customer record that shows up differently in sales, finance, and support. Each team may handle part of the workflow, but if no one owns the shared definition of a “customer,” then every dashboard tells a slightly different story. The technical systems may be running perfectly, and the data ownership may still be broken. That is why the question “Who owns this data when it changes, breaks, or gets disputed?” is so important; it reveals whether the business has a real steward for the truth, not just a folder full of reports.
So how do we clarify ownership without turning the room into a blame session? We start by naming the decision maker for the business outcome, not just the data table. If revenue numbers are disputed, who has the authority to define the metric? If customer status is inconsistent, who approves the rule that decides whether an account is active, paused, or closed? These are ownership questions because they connect the data to a real business choice, and once that choice is visible, the rest of the work becomes much clearer.
A good ownership model also separates creation from control. One team may create the data, another may clean it, and a third may use it, but only one person or group should own the final definition and escalation path. Without that separation, people assume someone else will fix the issue, and the issue keeps drifting from meeting to meeting. Clear data ownership makes the chain of responsibility visible, which means fewer guesses, fewer handoffs, and fewer surprises when a number changes.
If you are wondering what this looks like in everyday work, think of it as putting names next to the important questions. Who approves the source of truth, which is the agreed-upon version of the data everyone should trust? Who decides what happens when two systems disagree? Who reviews changes to the definition before they reach the dashboard? Those answers do not remove every problem, but they make the problems smaller, faster to resolve, and far less likely to return in the same form.
This is also where business ownership matters more than technical ownership. A warehouse engineer can make a table run efficiently, but they cannot decide what “qualified lead” should mean to sales. A data analyst can spot an anomaly, but they cannot assign the business rule that resolves it. When ownership lives with the people closest to the decision, the organization stops treating data as a mysterious artifact and starts treating it as part of normal operations.
Once ownership is clear, the conversation changes in a useful way. Instead of asking, “Who can fix the report?” we ask, “Who owns the outcome, and who needs to be involved to protect it?” That shift keeps the focus on the business problem, which is where it belongs, while still giving technical teams a clean path to implement the fix. In other words, data ownership is not about adding bureaucracy; it is about making sure every important number has a human answer behind it.
Align Metric Definitions
The moment we start comparing numbers across teams, the real problem often shows up: the same metric means different things to different people. One dashboard says revenue is up, another says it is flat, and suddenly everyone is debating the math instead of the business. That is why aligning metric definitions matters so much. If we do not agree on what a number means, then even the cleanest data pipeline can produce confusion, and the business problem stays unsolved.
A metric definition is the shared recipe for a number. It explains what counts, what does not, how the number gets calculated, and which time period it covers. A key performance indicator, or KPI, is a metric the business uses to judge progress toward a goal. When those definitions drift, teams can look at the same report and walk away with different conclusions, which is how trust starts to fray.
So how do we align metric definitions when everyone seems to be speaking a slightly different language? We begin by naming the business decision the metric is supposed to support. A “customer” means something different if sales is counting prospects, finance is counting billed accounts, and support is counting active users. Once we tie the metric to the decision, we can see why the number exists in the first place, instead of treating it like a floating fact.
This is where the earlier business symptom comes back into focus. If leaders are arguing over numbers, the symptom is not only a reporting issue; it is a sign that the organization has no shared source of truth, meaning the agreed-upon version of the data everyone should trust. A source of truth is less about one magical system and more about one agreed definition. That agreement reduces the back-and-forth that wastes time and makes teams hesitate before acting.
The cleanest way to align metric definitions is to write them down in plain language before anyone touches a dashboard. We ask: What exactly is included? What is excluded? What date determines whether something counts? What happens in edge cases, which are unusual situations that do not fit the normal rule? These questions sound small, but they are the guardrails that keep a business metric from wobbling every time a process changes.
A useful analogy is a kitchen shared by several cooks. If one person thinks a tablespoon is level and another thinks it is heaped, the recipe may look identical on paper while the result tastes different every time. Metric definitions work the same way. The data may be accurate, but if the measuring rules are inconsistent, the business will still get conflicting answers and wonder why the numbers never settle.
That is why ownership matters here too. Someone has to approve the definition, protect it when people want to change it, and decide how exceptions are handled. Without that steward, each team creates its own version of the truth, and the organization ends up with several metrics that share a name but not a meaning. When we align metric definitions, we are not adding bureaucracy; we are removing the hidden arguments that slow every decision down.
As we keep moving through the problem, this alignment becomes a bridge between business and technical work. The technical team can build the report correctly, but the business has to decide what the number should represent in the first place. Once that shared definition is in place, the dashboard stops being a source of debate and starts becoming a tool for action. And that is the point: not a prettier number, but a number the whole business can actually use.
Fix Workflow Root Causes
By the time we reach the workflow itself, the picture usually becomes much clearer. The business problem is no longer hiding inside a dashboard; it is sitting inside the way work moves from one person to the next. That is where a real data problem often begins, because a workflow that asks people to enter the wrong thing, at the wrong time, or in the wrong place will keep producing bad data no matter how polished the report looks. If we want a lasting fix, we have to treat the workflow as part of the data system, not as background noise.
This is the point where root cause thinking pays off. A root cause is the underlying reason a problem keeps happening, not the visible mistake we notice first. When a sales record is missing, the root cause may not be a broken field in the CRM, or customer relationship management system; it may be that the handoff from sales to operations is unclear, rushed, or rewarded poorly. In other words, the data problem is a signal, but the workflow is often the source.
So how do you fix workflow root causes when the symptoms keep showing up in different reports? We start by asking where the work becomes awkward for the people doing it. If someone has to copy the same information into three tools, wait for an approval before moving forward, or guess at a category because the form is vague, the workflow is creating friction. That friction pushes people toward shortcuts, and those shortcuts become errors, duplicates, and missing records. The fix is rarely to scold the team; it is to redesign the path so the correct action is also the easiest one.
That redesign usually means removing unnecessary handoffs. Every handoff is a place where a business process can lose context, delay action, or introduce inconsistency. If marketing passes a lead to sales, and sales then passes it to finance, each step needs a clear owner, a clear definition, and a clear trigger. When one of those pieces is missing, the workflow root cause shows up later as a data problem, but the real issue is that the process never gave people a clean way to succeed.
It also helps to look at timing, because many workflow problems are really timing problems in disguise. A field can be correct and still be useless if it is collected too late, after someone has already made a decision. A report can be accurate and still disappoint the business if it arrives after the moment when action was possible. If the workflow delays information, the organization starts improvising with side spreadsheets, chat messages, and manual overrides, and those workarounds become part of the problem we have to fix.
Another useful question is whether the workflow rewards the right behavior. People tend to follow the path that is fastest, safest, or most obvious, even if that path hurts the data. If a team is measured on speed, they may skip validation. If a manager cares more about closing tickets than entering complete notes, details will disappear. Fixing workflow root causes means looking at incentives, because a broken process often reflects a rational response to a badly designed system.
That is why the most effective repairs happen close to the work itself. We might simplify a form, add a validation rule, change the order of steps, or make a required review happen before the record reaches the next team. We might also remove a field that nobody uses or create a shared checklist that prevents silent assumptions. These changes may look small, but they matter because they reshape the business process where the data is born.
The best sign that we have found the right fix is that the process starts feeling lighter instead of more controlled. People spend less time reconciling, fewer exceptions pile up, and the same issue stops appearing in every meeting. That tells us we are no longer patching symptoms after the fact; we are improving the workflow that created the data problem in the first place. And once the workflow is healthier, the numbers usually start telling a much more trustworthy story.
Govern For Business Value
Data governance makes the most sense when we stop treating it like a rulebook and start treating it like a way to protect business value. After we have named the symptom, traced the process gap, clarified ownership, and aligned the metric definitions, governance becomes the quiet layer that keeps all of that from drifting apart again. Think of it less like a security guard at the door and more like the road markings that help everyone drive in the same direction. Without that shared structure, even good intentions start to pull the organization into confusion.
This is where many teams misunderstand data governance. They hear the phrase and picture approvals, committees, and slow-moving policy documents, but the real purpose is more practical than that. Data governance is the set of decisions, standards, and responsibilities that shape how data is created, used, and trusted across the business. If we ask, “How do we govern data for business value?” the answer starts with a simple idea: we protect the data that affects real decisions, not every possible field with the same amount of effort.
That distinction matters because not all data carries the same weight. A minor internal note and a customer billing record do not deserve the same level of attention, just as a side path and a highway need different kinds of traffic control. Good governance helps us sort data into the right lanes, so the important items get stronger rules, clearer ownership, and faster escalation when something changes. When we do that well, we reduce noise and spend our energy where the business actually feels risk.
The smartest governance programs begin with value, not volume. We ask which reports shape revenue, which datasets support compliance, which metrics influence hiring or inventory, and which workflows would hurt most if they went wrong. That question is the bridge between technical cleanup and business strategy, because it tells us where consistency matters most. If a dashboard drives daily decisions, then the rules around it should be tighter than the rules for an archive no one touches.
How do you govern data for business value without building a maze? We keep the controls close to the work. That means writing plain-language definitions, assigning a real owner for each critical dataset, setting review points at the handoffs, and deciding in advance what happens when something conflicts. When people know the rule, the reason behind it, and the person who can resolve an exception, governance feels less like friction and more like support.
This is also where governance connects back to trust. If leaders cannot explain where a number comes from, teams start creating side spreadsheets, manual checks, and private versions of the truth. Those workarounds may feel helpful in the moment, but they quietly multiply the business problem. Strong data governance reduces that shadow work by making the trusted path the easiest path, which is a powerful way to preserve both speed and confidence.
A good test is to ask whether a governance decision helps the business act faster, safer, or with less debate. If the answer is no, the control may be too broad, too vague, or aimed at the wrong problem. But when governance protects the processes, metrics, and records that matter most, it stops being overhead and starts becoming an operating advantage. That is the point where data governance and business value finally line up, and the organization can move forward with fewer surprises.