Start With Business Goals
Before we draw a single table or connect a single relationship, we need to know what the business is trying to accomplish. Data modeling works best when it starts with business goals, because a data model is not a decoration for a database; it is a working map of how the organization makes decisions, serves customers, and measures success. If you have ever asked, “How do I choose the right data model for my project?”, the safest answer is to begin with the outcome you want to support.
That might sound abstract at first, so let’s make it concrete. Imagine a retail company that wants to reduce abandoned carts, a hospital that wants faster patient reporting, or a subscription service that wants to understand why customers cancel. Each of those goals pulls the model in a different direction. In the retail case, the data model needs to capture shopping behavior in enough detail to spot friction; in the hospital case, it may need to prioritize accuracy, privacy, and clear clinical history; in the subscription case, it may need to track events over time so churn patterns become visible. The business goal gives the data modeling strategy its first clue about what matters and what can stay in the background.
This is where many teams get tangled up. They start with the tools they know, the systems they already have, or the tables they think they should create, and only later ask what the model is for. That often produces a data model that is technically neat but practically awkward, like a house built with beautiful rooms in the wrong places. A better approach is to describe the question the business wants answered, then work backward. Do we need to compare regions? Track customer journeys? Forecast inventory? Support compliance audits? Each answer changes which entities, attributes, and relationships deserve careful attention.
A helpful way to think about business goals is to treat them like the destination on a road trip. If the destination is a one-day drive, we pack differently than if we are crossing the country. In the same way, a short-term reporting need may call for a simpler data model with fewer layers, while a long-term analytics platform may need a design that can grow without becoming messy. The goal does not tell us every technical detail, but it does tell us the shape of the journey. That is why strong data modeling strategies always begin with a conversation about business value, not just data structure.
The best business goals are specific enough to guide choices, but broad enough to leave room for design. “Improve customer experience” is meaningful, but it is still too wide for modeling work. “Show support agents a full history of each customer interaction” is much more useful because it points to the exact kind of records we need, how they relate, and how fresh they must be. In practice, this is how data modeling becomes useful: we translate business goals into concrete information needs, then turn those needs into a data model that can answer questions reliably.
Once we do that, the rest of the work becomes easier to explain and defend. A star schema, a normalized design, or a domain-focused model is no longer a style choice made in a vacuum; it becomes a response to a real business goal. That shift matters because it keeps the team aligned when trade-offs appear, and trade-offs always appear. If the goal is fast reporting, we may accept some redundancy; if the goal is consistency across systems, we may choose tighter structure. The model starts to feel less like an academic diagram and more like a business tool, which is exactly what it should be.
So as we move forward, we keep one simple habit in mind: ask what decision, action, or outcome the data must support before asking how to store it. That question keeps the data modeling process grounded, and it helps every later choice feel connected instead of random. Once the business goal is clear, we can begin shaping the model itself with far more confidence.
Map Core Data Entities
Now that we know the business goal, the next step in data modeling is to name the main things the business actually cares about. In practice, this means mapping core data entities, which are the real-world people, places, events, or objects we want to store information about. If you have ever wondered, “What are the core data entities in a data model?”, this is the moment where the answer starts to take shape. We are not drawing tables yet; we are identifying the characters in the story.
A good way to begin is to imagine the business in motion. A retailer has customers placing orders, products moving through inventory, and payments confirming the sale. A hospital has patients, appointments, diagnoses, and care teams working together. A subscription company has accounts, plans, invoices, and usage events flowing through the system. These are the core data entities because they appear again and again in the business process, and the data model needs to recognize them before it can organize anything else.
The trick is to separate a true entity from a detail that belongs to it. An entity is a business thing we want to track on its own, while an attribute is a fact about that thing. A customer is an entity; a customer’s name, email address, and signup date are attributes. An order is an entity; its order number, status, and purchase date are attributes. This distinction matters because strong data modeling strategies depend on knowing what deserves its own identity and what should live as descriptive information attached to that identity.
As we map core data entities, we also start noticing relationships, which are the links between entities. A relationship explains how one business thing connects to another. For example, one customer can place many orders, and one order can contain many products. That kind of structure is easy to picture in real life: a customer walks into a store, fills a cart, and leaves with a receipt that ties everything together. In data modeling, those ties help us answer questions later without guessing how the business works.
This is also where many beginners ask a very practical question: how do you know which entities are truly core and which ones are secondary? The answer usually comes from frequency and business importance. If the business talks about it constantly, uses it in reports, or relies on it to make decisions, it probably belongs near the center of the model. A shipping address may matter a lot, but if it only exists to support delivery, it may belong as an attribute or a related entity depending on how often it changes and how many records can share it.
We also need to think about identity, which means how each record stays unique. A primary key is a value that uniquely identifies one record in an entity, like a customer ID or order ID. This may sound technical, but the idea is familiar: it is the name tag that keeps one customer from being confused with another customer who happens to share the same name. When we map core data entities carefully, identity keeps the model stable as the system grows and the data becomes more complex.
Good mapping is not about stuffing everything into one large structure. It is about creating a clean picture of the business so the model can support reporting, operations, and analysis without losing meaning. In a data modeling strategy, this step gives us the foundation for every later choice, from how we split tables to how we handle changes over time. Once the core data entities are clear, we can start shaping their attributes and relationships with much more confidence, and the rest of the model begins to feel like it has somewhere solid to stand.
Normalize Transactional Data
Once the core entities are clear, the next question is how to store them without the whole design turning into a tangle. That is where normalizing transactional data comes in: we organize records so each fact lives in the right place, appears once, and stays easy to update. In day-to-day data modeling, this is the difference between a system that behaves like a tidy filing cabinet and one that feels like a stack of duplicate sticky notes. If you have ever asked, “How do we normalize transactional data without making it harder to use?”, that is the balancing act we are stepping into now.
The basic idea is to separate one business fact from another instead of packing everything into a single wide table. A transaction is a business event, such as an order, a payment, or an appointment, and it often carries details that belong to different entities. In a normalized design, we keep the customer in one place, the order in another, and the order items in a third, so each piece has a clear home. That structure is part of good data modeling because it reduces repetition and makes the data easier to trust.
Here is why that matters in real life. Imagine a retail order table that repeats the customer’s name, email, shipping address, and product details on every line item. The moment a customer changes their email, you now have to update many rows, and one missed update can leave the system telling two different stories. Normalization prevents that kind of drift by storing shared information once and linking it through keys, which are unique identifiers that connect one table to another. In other words, we trade a little upfront structure for a lot of long-term clarity.
This is also where the idea of normal forms enters the room. A normal form is a rule or checkpoint that helps us judge whether a table is organized cleanly. The first normal form, for example, asks us to keep values atomic, meaning each field should hold one piece of information rather than a bundle of them. So instead of storing a list of product names in one cell, we give each product its own row in a related table. That small decision makes the data easier to search, update, and analyze without guesswork.
The pattern continues as we move through a normalized data model. We keep customer details with the customer, order details with the order, and line-item details with the line item, because each one has its own lifecycle. A customer may change addresses, an order may move from pending to shipped, and a product may appear on thousands of orders. When we separate those concerns, the model starts to mirror the business more faithfully, which is exactly what a transactional system needs. The design becomes less like one crowded suitcase and more like a set of labeled drawers.
That said, normalization is not about creating as many tables as possible. The goal is consistency, not complexity for its own sake. If we split data too aggressively, the model can become harder for people to read and for applications to query, especially when they need to assemble a full business view from many joins, which are links between tables used to combine related rows. So the real skill in data modeling is knowing when the structure is helping and when it is getting in the way.
For transactional data, though, normalization usually earns its place because transactions depend on accuracy. Orders, payments, inventory changes, and patient visits all need a reliable record of what happened and when it happened. A normalized design supports that by making updates safer, duplicates less likely, and relationships more explicit. In practice, that means the data model can answer questions like “Which customer placed this order?” or “Which items belong to this transaction?” without relying on copied information that may drift out of sync.
So as we normalize transactional data, we are not just rearranging tables. We are giving the business a cleaner way to capture events, protect important facts, and keep relationships honest over time. That foundation matters because later decisions, from reporting to analytics to system integrations, all depend on whether the transactional layer tells a single, dependable story.
Build Analytics-Friendly Schemas
Now that the transactional side is clean and dependable, we can shape the data for a different kind of job: analysis. This is where analytics-friendly schemas come in, and the shift matters because people do not query data the same way machines store it. A report writer or a business intelligence (BI) tool, which is software for building dashboards and reports, wants fast answers and easy reading. So the question becomes: how do you turn a tidy transactional model into something analysts can actually use?
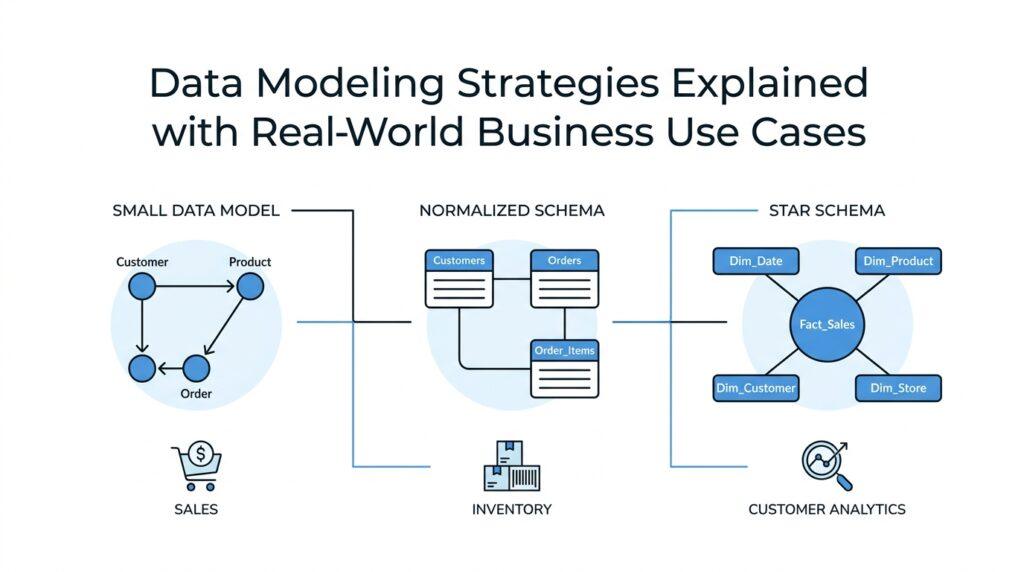
The most common answer is to organize the data around a fact table and dimension tables. A fact table stores measurable events, like sales, visits, or clicks, while a dimension table stores the descriptive context around those events, like customer, product, region, or date. If that sounds abstract, picture a sales dashboard: the sales numbers are the facts, and the labels that help explain them are the dimensions. This kind of schema design is often called a star schema because the central fact table sits in the middle like the hub of a wheel, with related tables around it.
What makes this structure so useful is that it matches the way people ask questions. Analysts usually want to group, filter, and compare, not trace every tiny transactional detail across many tables. In a data modeling strategy, that means we often denormalize for analytics, which means we intentionally place related descriptive data together so queries are simpler and faster to read. Instead of forcing a report to assemble customer region, product category, and calendar date from several scattered places, we give those values a clearer home. The result is a model that feels friendlier to dashboards, self-service reporting, and ad hoc exploration.
A helpful idea here is the grain of the fact table, which means the exact level of detail each row represents. One row might mean one order line, one daily store total, or one website session, depending on the business question we want to support. Getting the grain right is one of the most important parts of analytics-friendly schemas because it keeps measures from being doubled, blurred, or misunderstood. If we choose the wrong grain, even a beautiful report can tell the wrong story, and that is where careful data modeling earns its keep.
We also want the dimensions to stay stable and easy to understand. A dimension is a descriptive table that gives facts context, and in analytics it often includes text labels, categories, and dates that people use for slicing data. Think of it like the legend on a map: the facts tell us where we are, but the dimensions help us interpret the landscape. When we build analytics-friendly schemas, we usually keep these tables readable and consistent so analysts can trust the names, time periods, and categories they see in every chart.
This is also why analytics models often borrow a little flexibility from the business rather than insisting on perfect structural purity. We may repeat a customer’s region in a dimension table if that makes reporting easier, even though a normalized system would store that detail elsewhere. That is not carelessness; it is a design choice made for a different audience. Transactional models protect updates and operational accuracy, while analytics schemas protect clarity, speed, and usability for reporting.
If you have ever wondered whether a schema is truly analytics-friendly, look at how quickly someone can answer a common business question. Can they see monthly revenue by region without wrestling with joins, which are links between tables that combine related rows? Can they compare products across time without guessing which table contains the right label? When the answers feel direct, the schema is doing its job. In a strong data modeling approach, the analytics layer should make the business feel visible, not buried.
That is the real payoff. We start with clean transactional data, then reshape it into a structure that helps people explore trends, compare performance, and make decisions with confidence. The schema does not need to be fancy to be effective; it needs to reflect the questions the business asks most often. When we keep that goal in view, analytics-friendly schemas become less like a database trick and more like a well-lit room where the story in the data is finally easy to see.
Match Models To Use Cases
By this point, we have the raw ingredients for a good data model: we know the business goal, we have mapped the core entities, and we have seen how transactional data and analytics-friendly schemas serve different jobs. The next step is the one that often feels hardest at first: matching the model to the use case. So how do you know which data modeling strategy belongs in which situation? The answer is to start with the kind of work the data must do every day, because the best model for an order system is not always the best model for a dashboard, an audit trail, or a customer profile.
The easiest way to think about this is to picture the data model as a tool in a workshop. A hammer is excellent for nails, but terrible for turning screws. In the same way, a normalized model is a strong fit when the business needs reliable updates and a clean record of transactions, while a star schema is a better fit when analysts need fast, readable reporting. If your system must record orders, payments, or appointments as they happen, a normalized structure usually wins because it protects accuracy. If your users ask for monthly sales by region or product, an analytics-friendly schema often gives them answers faster and with less friction.
This is why the phrase “best data model” can be misleading. Best for what? A hospital scheduling system, for example, usually needs careful structure, because one appointment may connect to a patient, a provider, a room, and a time slot, and every change matters. A subscription analytics platform, on the other hand, may care more about trends over time, so it benefits from a model that makes comparisons easy and keeps history visible. The same business can even need more than one model, with one design supporting operations and another supporting reporting. That is not duplication; it is a sign that the model is serving the real shape of the work.
A practical way to choose is to ask how often the data changes and who needs to read it. When the answer is “often, and the application must update it safely,” we usually lean toward a more normalized design. That is because normalized data modeling keeps each fact in one place, which reduces conflicts and duplicate updates. When the answer is “mainly for analysis, and people want to compare patterns quickly,” we usually lean toward a denormalized design, such as a star schema, because it makes the model easier to query and understand. The model follows the rhythm of the use case, not the other way around.
Sometimes the right choice is less about speed or structure and more about history. If a business needs to preserve how something changed over time, such as a customer’s address, a product category, or a contract status, the model must keep past and present versions from blending together. That is where designs built for historical tracking become valuable, because they let us tell a truthful story about what the data looked like at each moment. In real terms, this is what keeps reporting from saying, after the fact, that last quarter looked the same as this quarter when it clearly did not.
It also helps to remember that use cases live at different layers. An operational system supports the daily business, a reporting layer supports questions and dashboards, and an integration layer helps systems share data without stepping on each other’s toes. Each layer may need a different shape, even when they all describe the same customer, order, or appointment. That is one of the quiet truths of data modeling: the model is not a single masterpiece we create once. It is a set of choices that should fit the job in front of us.
When we match models to use cases, we stop treating data modeling as an abstract design exercise and start treating it like a practical decision-making process. We look at the business question, the expected users, the rate of change, and the need for history, then choose the structure that helps the data do its work well. That mindset keeps the model grounded, useful, and easier to defend when the trade-offs show up, because they always do.
Validate And Refine Designs
Once the first version of a model is on the page, the real work begins: we test it against the messy, everyday questions the business will actually ask. How do we know whether this data model will hold up when real people start using it? We walk it through the same paths it will travel in production, checking that primary keys still identify rows cleanly, foreign keys still connect the right tables, and the overall shape still fits either a normalized transactional design or a star schema built for analysis. Validation is where a data modeling strategy stops being a sketch and starts proving itself.
A good way to do this is to build a small prototype and feed it a few real-looking records, not perfect ones. We want the awkward cases too: a customer who changes addresses, an order with many line items, a subscription that pauses and resumes, or a patient visit that gets corrected after the fact. Microsoft’s dimensional modeling guidance emphasizes matching and loading source rows by business keys, which is a useful reminder that validation starts with real source behavior, not idealized table shapes. When a design survives those sample stories, we know it is moving in the right direction.
This is also the moment to ask whether each table has one clear job. If a table starts carrying too many meanings at once, the model becomes harder to trust, because one business fact gets repeated in several places or tied to the wrong lifecycle. Microsoft’s normalization guidance makes the same point in a practical way: relationships help keep the one side and many side separate, which reduces redundancy and keeps the data easier to manage. For analytics, the same check helps us confirm that fact tables hold measurements and dimension tables hold the descriptive context those measurements need.
Then we test the joins, because joins are where a model often reveals its hidden friction. A join is the link that lets us combine related rows from different tables, and if the join path feels confusing, slow, or inconsistent, the design probably needs refinement. In a star schema, Microsoft notes that the fact table sits at the center and the related dimensions form the points of the star, and that structure is meant for analytic query workloads. That matters because the grain of the fact table—the exact level of detail one row represents—has to stay consistent, or the numbers can quietly drift.
Refinement also means deciding how the model should handle change over time. Some business questions only care about the current state, while others need the history, and those two needs lead to different design choices. Microsoft’s slowly changing dimension guidance describes this trade-off clearly: type 1 keeps the latest value, while type 2 preserves historical versions by adding new rows for changes. So if a customer’s region changes, or a product moves categories, we have to decide whether the model should overwrite the old value or keep both versions so later reporting can tell the full story.
At this stage, feedback from the people who will live with the model matters as much as the technical checks. If analysts cannot recognize the names, if operators cannot trace a record through the system, or if the report logic feels like a puzzle, the design still has room to improve. A practical refinement might be splitting an overloaded entity, moving descriptive fields into a dimension table, or simplifying a path that requires too many joins for everyday work. Star schema guidance notes that dimensional models are often easier to evolve when the business expands, so small adjustments here can pay off later in clarity and maintenance.
What we are really doing, then, is comparing the model to the story the business needs told back to it. If the tables answer the right questions, keep history straight, and stay readable under pressure, the design is ready to grow. If not, we refine again—smaller adjustments, cleaner relationships, clearer grain, and a tighter match between the data model and the work it supports.