Define Reliability Targets
Before a self-healing data pipeline framework can repair anything, it needs a clear picture of what “healthy” looks like. That is where reliability targets come in: they are the numbers and rules we use to define acceptable behavior for the data pipeline, the way a thermostat defines the room temperature we want to keep. Without them, every alert feels vague, every retry feels random, and we end up fixing problems by instinct instead of by design. When you define reliability targets early, you give the whole system a shared destination.
The easiest way to think about this is to separate business impact from technical behavior. A Service Level Objective, or SLO, is a reliability goal we want to hit, such as keeping data available 99.9% of the time or delivering a daily report before 8 a.m. A Service Level Agreement, or SLA, is the promise we make to someone else, often a customer or internal partner, about what happens if we miss that goal. In practice, reliability targets for a data pipeline work like guardrails: they tell us when the pipeline is still safe to trust and when it has drifted far enough to need intervention.
What should a reliability target look like in a real data pipeline? It should be specific enough to measure and meaningful enough to matter. For example, if a downstream finance team depends on refreshed numbers each morning, “good enough” is not a target, but “data arrives by 7:30 a.m. on 99.5% of business days” is. That kind of statement gives the self-healing data pipeline framework something concrete to watch, compare, and protect. It also helps us avoid one of the biggest beginner mistakes: measuring the pipeline in terms that feel technical but do not reflect the actual experience of the people using the data.
The next step is deciding which signals deserve your attention. Freshness is one signal, meaning how recently the data was updated. Completeness is another, meaning whether all expected records arrived. Accuracy, consistency, and latency all matter too, and latency means the delay between when data is created and when it becomes usable. We do not need every target to be perfect from day one; we need the few that most clearly describe the risk we are trying to control. A strong set of reliability targets turns a noisy pipeline into a readable story.
This is also where thresholds become useful. A threshold is the line that separates normal behavior from trouble, like a smoke alarm set to go off only when the room really fills with smoke. If late-arriving data is common but harmless for the first 10 minutes, then the alert should not fire at minute one. If missing records create reporting errors, then even a small gap may deserve immediate attention. By tying thresholds to impact, we make the self-healing data pipeline framework smarter, because it can decide when to retry, when to isolate bad data, and when to escalate to a human.
If you are wondering how to choose the right numbers, start with the people who feel the pain when the pipeline slips. Ask what breaks first, what delay is tolerable, and what error rate would change a decision. That conversation often reveals that reliability targets are less about perfection and more about protecting trust. Once you know the real cost of delay or bad data, you can set goals that are realistic, defensible, and easy to explain.
The real value of reliability targets is that they make healing intentional instead of reactive. Once the targets are clear, the pipeline can compare live behavior against expectations and choose the right response in real time. That gives us a shared language for the next step: turning those targets into alerts, automated checks, and repair actions that keep the system steady when something goes wrong.
Map Pipeline Dependencies
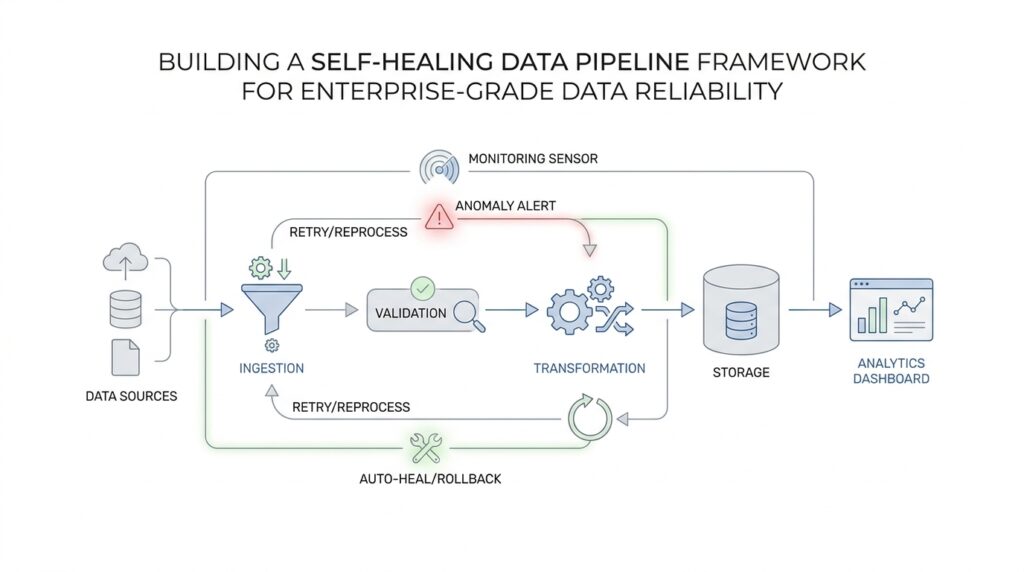
Once we know what healthy looks like, the next job is to trace how that health is actually produced. That is where pipeline dependencies come in: before a self-healing data pipeline framework can repair a failure, it needs to know which steps feed which other steps, and which outputs matter most. How do you map pipeline dependencies when one daily report depends on a chain of ingestion, transformation, and publishing jobs? We start by drawing the chain clearly, because orchestration systems model workflows as a directed acyclic graph, or DAG, which is a diagram of tasks connected by one-way dependencies.
That picture sounds technical, but the idea is familiar. If you think of a kitchen service, the salad cannot leave before the vegetables are washed, and the dessert station does not need to wait on the soup. In the same way, Airflow describes a DAG as a collection of tasks with directional dependencies, where upstream tasks must finish before downstream tasks can run. That upstream and downstream language matters because it gives us a plain-English way to talk about pipeline dependencies without getting lost in tool-specific details.
The story becomes more interesting when we look beyond a single workflow. One pipeline may trigger another, wait for another, or hand off data to a separate system entirely, and OpenLineage distinguishes between execution dependencies, which are control-flow relationships, and data lineage, which shows how datasets are produced and consumed. That distinction is useful because not every job that runs after another job is actually using its data, and a self-healing data pipeline framework should know the difference before it decides what to retry or quarantine. In other words, pipeline dependencies are not only about order; they are also about meaning.
Once the relationships are visible, we can read the blast radius of a failure instead of guessing it. OpenLineage says lineage metadata helps users identify root causes and understand the impact of changes, and its lineage graph connects jobs with the datasets they produce and consume. That is the practical prize of mapping dependencies: if a source table arrives late, we can see which reports, dashboards, and models are affected downstream, rather than discovering the damage one team at a time. This is also why dependency mapping belongs beside reliability targets rather than after them; the targets tell us what matters, and the dependency map tells us where to look first.
At this stage, the best way to build the map is to work backward from the most important output. We begin with the report, feature table, or customer-facing dataset that people actually rely on, then trace each upstream input until we reach the source systems. Along the way, we note owners, schedules, handoff points, and any place where one failure could quietly cascade into another. This is partly a documentation exercise and partly a design exercise, because a good dependency map does not just describe the pipeline; it tells the self-healing logic where to stop, where to retry, and where to escalate. That is an inference from how orchestration tools model dependencies and how lineage systems expose runs, jobs, and datasets.
The final benefit is control. When the framework knows the shape of the pipeline dependencies, it can react with more than blind retries: it can pause a downstream job that would only amplify bad data, restart a failed branch, or notify the right owner before the problem spreads. Airflow’s DAG model centers on execution order, retries, and upstream/downstream relationships, which makes it a natural fit for that kind of guarded response. Once we have that map, we stop treating every alert like a fire drill and start treating each failure like a path we can trace, understand, and repair with intention.
Add Data Quality Checks
Once we know where the pipeline can bend and break, the next question is more personal: how do we know the data itself is trustworthy before it reaches anyone? That is where data quality checks step in. In a self-healing data pipeline framework, these checks act like a careful gatekeeper at the door, looking for signs that the incoming batch is incomplete, malformed, or simply not what we expected. If the dependency map tells us where the data flows, data quality checks tell us whether that flow still deserves to continue.
The easiest way to think about this is to imagine receiving a package with a broken seal. You would not rush it straight into the house; you would inspect it first. Data quality checks work the same way, only the package is a table, file, or event stream, and the seal is made up of rules. A good rule can be as simple as “this column must never be empty” or as specific as “the order total must be greater than zero and match the sum of its line items.” These rules do not need to be clever on day one. They need to protect the decisions that depend on the data.
What should we check first? In practice, we start with the failures that would cause the most harm. Schema validation, which means confirming that the data still has the columns and types we expect, catches changes that can break downstream jobs without warning. Completeness checks look for missing records or missing fields. Uniqueness checks make sure we do not count the same thing twice, while range checks confirm that values stay inside believable limits. Together, these data quality checks turn vague suspicion into clear signals, so the pipeline can decide whether to continue, retry, or stop the line.
That last part matters more than it may seem. A self-healing data pipeline framework should not treat every problem the same way, because not every problem has the same shape. If a source file arrives a few minutes late, the safest response may be to wait and retry. If the file arrives with the wrong columns, the safer response may be to quarantine it and protect downstream consumers from bad assumptions. If only a small portion of rows fails validation, the pipeline may isolate those rows, log the defect, and keep the clean data moving. The quality check is not just a pass-or-fail test; it is the trigger that helps us choose the right kind of healing.
This is also where thresholds give the checks real meaning. A threshold is the point where a pattern becomes concerning, and in data quality work it keeps us from overreacting to harmless noise. For example, one missing optional field might be acceptable, but a spike in null values across a critical column is a very different story. Likewise, a few duplicate records may be tolerable in a staging area, while duplicates in a customer ledger can create real financial confusion. When we define thresholds around business impact, data quality checks become practical rather than punitive.
If you are wondering how to design these checks without drowning in rules, begin with the journey of the data you already mapped. At each handoff, ask what could go wrong, what would be dangerous to ignore, and what kind of failure the system can correct on its own. That approach keeps the checks close to the risk instead of piling on generic tests that produce noise. It also helps us place the checks where they matter most: at ingestion for source trust, after transformation for logic trust, and before publishing for consumer trust.
The real value of data quality checks is that they give the pipeline a conscience. Instead of letting every batch march forward on faith, the framework evaluates whether the data still deserves confidence. That confidence can then power the next layer of automation: alerts that mean something, retries that happen for the right reason, and self-healing actions that protect downstream systems before a small defect turns into a wide mistake.
Detect Schema Drift
Now that the pipeline knows what good data looks like, we need a way to notice when the shape of that data starts changing under our feet. That is the heart of schema drift, which means the structure of a dataset no longer matches the structure we expected. Maybe a column disappears, a new field appears, or a number quietly turns into text. How do you detect schema drift before it breaks everything? We watch for those changes as soon as data arrives, because the earlier we catch them, the less damage they can do to the self-healing data pipeline framework.
The first step is to keep a clear baseline. A baseline is the known-good version of a dataset’s shape: the column names, data types, and whether each field is required or optional. Think of it like the blueprint for a house. If the blueprint says there should be a door in one place and a window in another, we notice quickly when the next batch shows up with the door missing or the window moved. Schema drift detection works by comparing incoming data against that blueprint instead of trusting every batch to stay the same.
That comparison can happen in a few ways, and the simplest version is still powerful. We can check whether expected columns are present, whether unexpected columns have appeared, and whether each value still fits the type we asked for. A column that used to hold dates but now contains free-form text is a classic sign of trouble. So is a field that was once required suddenly arriving empty. These checks sound small, but they are often the first visible crack before a downstream job fails in a much louder way.
A stronger approach adds a schema registry, which is a central catalog of approved data shapes and their versions. Instead of letting every producer invent a new format whenever it wants, the registry records what changed, when it changed, and whether that change is safe for consumers. That matters because not every change is equally dangerous. Adding a new optional field may be harmless, while renaming a required field can break a report or model immediately. By keeping versions, the self-healing data pipeline framework can tell the difference between a friendly update and a risky surprise.
This is where drift detection becomes more than a checklist and starts becoming a safety system. When the pipeline sees a mismatch, it should ask a simple question: is this a small, compatible change, or is this a shape change that could confuse downstream systems? If the answer is unclear, the safer move is to quarantine the batch, alert the owner, and keep bad structure from spreading. In other words, schema drift detection is not only about spotting the problem; it is about giving the pipeline enough context to choose the right response.
Some teams also watch for gradual drift, which happens when the schema does not change all at once but slowly slides over time. A field might grow more empty, a value range might widen, or a nested object might gain new branches one by one. Those changes are easy to miss if we only look for dramatic failures. That is why the self-healing data pipeline framework should compare the current batch not just to the latest batch, but also to historical patterns, so it can recognize when “normal” is quietly becoming something else.
The most useful schema drift detection setups are the ones tied to impact. If a downstream dashboard only needs three fields, then a fourth optional field may not matter. If a machine learning feature table depends on exact types and column order, then even a small shift can be serious. By linking drift checks to the pipeline dependencies we already mapped, we can see which outputs are at risk and decide whether to retry, transform, pause, or escalate. That turns schema drift from a vague warning into an action plan.
When this works well, you feel the difference immediately. The pipeline stops treating every unexpected shape like a disaster and starts treating each one according to its real risk. Some drift gets absorbed by a controlled transformation, some gets blocked at the gate, and some gets handed to a human with clear evidence attached. That is the quiet strength of schema drift detection: it gives the system enough awareness to stay flexible without becoming fragile.
Automate Failure Recovery
Now that we can spot bad shapes and suspicious batches, the next question is what the pipeline should do the moment something breaks. That is where failure recovery enters the picture. In a self-healing data pipeline framework, failure recovery means the system does not freeze at the first sign of trouble; it follows a planned response, much like a pilot switching to backup instruments when the main panel goes dark. We are no longer asking, “Did something fail?” We are asking, “What is the safest automated recovery action right now?”
The most common place to start is with retries, which means trying a failed step again after a short pause. A retry policy is the rule that controls how many times we try, how long we wait between attempts, and which kinds of errors deserve another chance. That distinction matters because a temporary network hiccup and a broken schema do not need the same treatment. If the pipeline blindly retries everything, it wastes time and can even make the problem noisier; if it retries nothing, it gives up on recoverable issues too quickly. A good self-healing data pipeline framework uses retries like a skilled mechanic uses a wrench: only where they make sense.
From there, the story gets more interesting because not every failure should be handled by repeating the same move. Sometimes the right response is rerouting, which means sending the workload through an alternate path, queue, or backup source. Imagine a road closure on your commute: you do not keep driving into the barrier; you take the detour that gets you to the same destination. In a data pipeline, rerouting can keep critical reporting or downstream jobs moving while the primary path is repaired, and that keeps the failure from spreading into a larger outage.
How do we know when to retry, reroute, or stop? We use the reliability targets and dependency map we already built, because automated recovery works best when it understands impact. If a late source feed only delays a low-priority dashboard, the framework may wait and retry in the background. If a broken input would corrupt finance numbers or features used by a model, the safer choice may be to quarantine the batch, pause downstream jobs, and alert the owner immediately. This is the heart of failure recovery in a self-healing data pipeline framework: matching the response to the risk instead of treating every incident like the same kind of fire.
Another powerful tool is rollback, which means returning to the last known-good version of data, code, or configuration. That phrase sounds dramatic, but the idea is familiar: if you accidentally save over a file with bad edits, you want yesterday’s version back. In pipelines, rollback protects us when a recent change introduced the problem, whether that change came from a code deployment, a schema update, or a transformation rule. Combined with versioning, rollback gives automated recovery a safe exit ramp, so the system can recover without waiting for a human to reconstruct the past.
We also need guardrails, and one of the most useful is a circuit breaker, which is a control that temporarily stops repeated failures from hammering a broken dependency. Think of it as the fuse box in a house: when a circuit becomes dangerous, it shuts things down before the damage spreads. In a data pipeline, a circuit breaker can pause repeated calls to an overloaded source, hold back downstream execution, and prevent a small outage from turning into a chain reaction. That kind of protection is especially valuable when multiple jobs depend on the same fragile service.
The best recovery systems do more than act; they explain what they did. Every automated recovery step should log the trigger, the decision, and the result so we can learn from each incident instead of guessing later. Did the retry succeed on the second attempt? Did the reroute keep the report on time? Did the rollback restore trust in the data? Those answers turn each incident into a lesson, and over time they help the self-healing data pipeline framework become calmer, faster, and more precise.
If you are wondering how to bring this to life, start small with the failures you already understand. Pick one critical path, define the safe response for each common error, and test it in a controlled way before you trust it in production. That approach keeps automated recovery grounded in reality, not wishful thinking, and it helps the pipeline recover in a way that protects both the data and the people who rely on it. Once those responses are in place, the framework can move from noticing trouble to handling it with confidence.
Monitor and Tune Continuously
Once the pipeline can repair itself, the next challenge is making sure those repairs are actually helping. A self-healing data pipeline framework is still a living system, and living systems drift: a retry that saves one batch today can hide a deeper issue tomorrow. That is why monitoring data pipeline behavior matters so much here. Apache Airflow’s production docs frame logging, metrics, traces, health checks, and notifications as core parts of observability, because you cannot improve what you cannot see.
The simplest way to keep that visibility useful is to watch the few signals that tell the real story. Instead of staring at every log line, we can track whether runs are finishing on time, whether retries are increasing, whether validation is passing, and whether data freshness still matches the reliability targets we set earlier. Great Expectations supports this kind of feedback loop by saving validation results, running actions after a checkpoint, and turning those results into human-readable Data Docs that keep the history easy to review.
That history becomes even more valuable when we connect it to lineage. OpenLineage collects metadata about datasets, jobs, and runs, and its documentation says that this information helps users identify root causes and understand the impact of changes. In practice, that means a slow source or a bad transformation is no longer a mystery in the dark; we can trace which downstream tables, dashboards, or models are exposed and decide whether the issue is local or spreading. For a self-healing data pipeline framework, that context is what turns a generic alert into a useful one.
How do you keep the alerts from becoming noise? We tune them the same way we tune a musical instrument: by listening for patterns, not single notes. Google SRE guidance notes that alerts can flap, meaning they bounce between firing and recovering too quickly, and it recommends alert rules that require a condition to persist for a minimum duration before paging. That idea fits data pipelines well, because a brief failure that heals itself may deserve a log entry, while the same failure repeating across runs deserves human attention.
This is where continuous tuning starts to feel like craftsmanship rather than maintenance. If a check fires constantly, we ask whether the threshold is too strict, whether the source system is naturally noisy, or whether the response should be downgraded from a page to a note. If the same fallback path activates every day, that is a signal that the self-healing data pipeline framework is compensating for a design problem instead of a temporary glitch. Great Expectations keeps validation results over time, which makes trend review and root-cause hunting much easier than relying on memory alone.
The real payoff is that monitoring becomes a learning loop. Each incident leaves behind a trail: the logs show what happened, the validation results show what failed, and the lineage graph shows what else might be affected. Airflow’s monitoring model gives operators the operational detail they need, while OpenLineage and Great Expectations add the context needed to decide whether to retry, pause, reroute, or change the rule itself. That is the quiet promise of continuous tuning in a self-healing data pipeline framework: the system gets a little wiser every time it meets trouble.