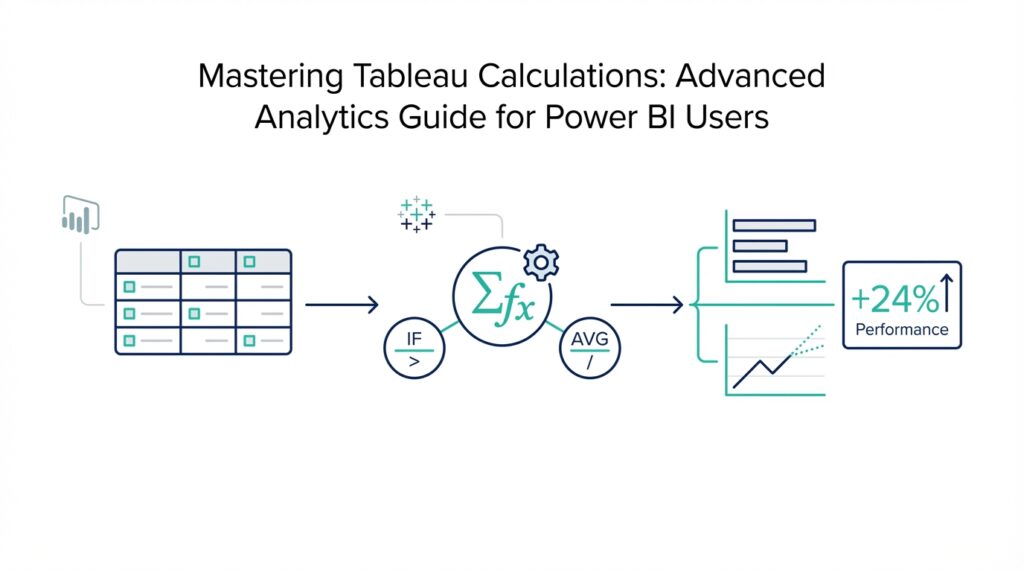
Power BI to Tableau Mindset
When you first move from Power BI to Tableau, it can feel like you’ve entered a new kitchen where the tools look familiar but the recipes work differently. The biggest shift is not memorizing new buttons; it is learning the Power BI to Tableau mindset, especially how Tableau calculations think about the data in front of them. If you have ever wondered, “Why doesn’t this formula behave the way it did in Power BI?”, you are asking the right question. In Tableau, the answer usually lives in the order of operations, the level of detail, and the way the view itself shapes what the calculation can see.
That difference matters because Power BI often encourages you to think in terms of a model first and a visual second. Tableau invites you to think in the opposite direction: start with the view, then ask what calculation belongs at that level. A calculated field in Tableau is a formula that creates a new value from your data, but unlike a measure sitting quietly in the background, it often reacts to the dimensions and filters in the worksheet. In other words, Tableau calculations are not only about what you write; they are about where that logic lives.
This is where many Power BI users stumble, and it is a completely normal step in the journey. In Power BI, you may be used to a measure—a dynamic calculation that responds to filter context in a fairly model-driven way. In Tableau, the same-looking idea can behave differently because Tableau separates calculations into layers such as row-level calculations, aggregate calculations, and table calculations—formulas that compute after the data has already been arranged in the view. The important habit is to pause and ask, “Am I calculating before aggregation, after aggregation, or after the table is already built?”
Once you start asking that question, Tableau becomes much less mysterious. Picture a calculator on a desk versus a chef tasting a finished dish. A row-level calculation is like counting ingredients one by one before they go into the pot, while an aggregate calculation is like tasting the whole soup after everything has been mixed together. A table calculation is the final adjustment at the table, where the presentation already exists and the formula works across what the view shows. That mental picture helps you place each formula in the right stage instead of forcing it to act like a Power BI measure.
Another helpful shift is to stop thinking that every answer must come from one formula. In Tableau, the view itself is part of the logic, which means dragging a field into rows, columns, or color can change the meaning of the numbers you see. That is why Tableau calculations often feel less like isolated code and more like a conversation between the formula and the layout. If your result looks strange, the problem may not be the formula at all; it may be the level of detail you asked Tableau to show.
So how do we make the transition smoother? We begin by translating your Power BI habits into Tableau habits. Instead of asking, “What measure do I need?”, ask, “What question should this worksheet answer, and at what grain should it answer it?” The grain is the level of detail in the data, such as by order, by customer, or by month. That one question often prevents confusion before it starts, because Tableau calculation behavior makes far more sense when the grain is clear.
As you practice, you will notice that Tableau rewards patience more than speed. You may build a calculation, place it in the view, and then adjust the dimensions or filters until the result matches the story you want to tell. That is not a detour; it is the process. The more you treat the worksheet as a living scene rather than a static canvas, the easier the Power BI to Tableau mindset becomes, and the more naturally advanced analytics will start to feel.
Tableau Calculation Types
Now that we’ve seen how the worksheet shapes the answer, the next question is the one every newcomer eventually asks: What are the different Tableau calculation types, and when should I use each one? This is where Tableau stops feeling like a mystery box and starts feeling like a set of tools arranged on a workbench. Each calculation type solves a different problem, and the trick is not memorizing names but recognizing the moment you need one.
The first layer is the row-level calculation, which means a formula that works on each individual record before Tableau groups anything together. Think of it like checking each apple in a crate before you decide how many crates you have. If you want to create a flag for whether a sale was profitable, or combine first name and last name into a full name, this is the level where Tableau should do the work. In Tableau calculations, row-level logic is the most literal because it looks at the raw data one row at a time.
From there, we move into the aggregate calculation, which combines many rows into a single result such as a sum, average, or count. This is the stage where the apples are no longer individual apples; they become baskets, and we ask how many baskets there are or how heavy they are together. Aggregate calculations are the ones that often feel closest to a Power BI measure, because they respond to the grouping in the view. If your question is about totals, averages, or comparisons across categories, this is usually where the answer belongs.
Then comes the part that feels a little more like Tableau’s special language: the table calculation. A table calculation is a formula that runs after Tableau has already built the view, so it uses the numbers that are visible on the screen rather than the raw rows underneath. This is why running totals, percent of total, and rank often live here. The important shift is that the calculation does not create the table; it reads the table that already exists, which is why the arrangement of rows and columns changes the result.
If you’ve ever wondered, “Why does my number change when I move a field?” this is usually the reason. Table calculations are sensitive to the shape of the view, so the same formula can behave differently depending on how the data is laid out. That can feel frustrating at first, but it is also powerful because Tableau calculation types let you decide whether the logic should happen before grouping, during grouping, or after the view is assembled. Once that order becomes familiar, the worksheet starts to feel far more predictable.
There is one more important character in this story: the level of detail expression, often shortened to LOD expression. A level of detail expression is a calculation that lets you control the grain, or level of detail, independently from the view. In plain language, it gives you a way to say, “Compute this at the customer level,” even if your chart is currently showing months or regions. For Power BI users, this can feel like stepping outside the visual and telling Tableau exactly which layer of the data should matter.
That distinction is where many people begin to see the real strength of Tableau calculation types. A row-level calculation shapes the record, an aggregate calculation shapes the summary, a table calculation shapes the displayed result, and an LOD expression shapes the level at which the logic lives. They are not competing ideas; they are different doors into the same room. When you choose the right one, your workbook becomes easier to trust because the numbers are telling the story you intended, not a story the view accidentally created.
So when you build your next calculated field, pause before writing the formula and ask what kind of answer you need. Do you want to transform each row, summarize the data, work from the finished view, or lock the logic to a specific level of detail? That small habit is the bridge between confusion and control, and it is one of the quickest ways to feel at home with Tableau calculations.
Set Up LOD Expressions
Now that we know an LOD expression can step outside the view, the next move is to build one with a clear sense of purpose. The easiest way to start is inside a calculated field, where Tableau expects you to write the formula in braces using a scoping keyword, a dimension declaration, a colon, and then the aggregate expression. In practice, that means you are telling Tableau, “Compute this at this level, even if the worksheet is showing something else.” Tableau also allows a table-scoped version with no scoping keyword at all, which behaves like a FIXED expression without a declared dimension.
The real setup work happens before you type much at all. First, decide what grain you want the answer to live at, because the dimension declaration is the part that gives the calculation its home. Tableau recommends dragging fields into the calculation editor rather than typing them, since that helps the dimension declaration match the field exactly as Tableau knows it. That small habit matters more than it sounds, because Tableau does not treat a saved calculation name as interchangeable with the original field expression behind it.
If you are asking, “How do I create an LOD expression in Tableau without making it fight the view?”, the answer is to begin with FIXED when you want the value to stay anchored to specified dimensions. A FIXED level of detail expression computes using only the dimensions you name and ignores the view’s level of detail, so every mark can show the same result for that fixed grain. Tableau also notes that FIXED ignores filters in the view except context filters, data source filters, and extract filters, which is why filter placement matters so much here.
INCLUDE works a little differently, and this is where the setup starts to feel more like shaping a lens than writing a formula. An INCLUDE LOD expression computes using the dimensions you name plus whatever is already in the view, which makes it useful when you want a finer-grained calculation in the data and then a coarser answer on the worksheet. Tableau also says INCLUDE expressions change as you add or remove dimensions from the view, so the formula stays flexible instead of locked to one exact layout.
EXCLUDE is the sibling that removes rather than adds. When you set up an EXCLUDE LOD expression, you are telling Tableau to subtract a dimension from the view’s level of detail, which makes it handy for ideas like percent of total or difference from an overall average. Tableau also points out that EXCLUDE cannot be used in row-level expressions, because there is no view-level dimension to remove there; it is meant to modify a view-level calculation or another LOD expression.
The last part of the setup is putting the calculation into the worksheet and letting Tableau do its re-aggregation. In the examples from Tableau’s own help, an INCLUDE calculation such as { INCLUDE [Customer Name] : SUM([Sales]) } can be placed on a shelf and then aggregated as AVG to show an average customer amount by region. That pattern is the heart of many LOD expressions: you define the hidden grain first, then choose how the view should summarize it.
Once you start building LOD expressions this way, the process feels less like memorizing syntax and more like setting coordinates on a map. You choose the grain, write the expression, check the filters, and then place the result in the view to see whether the story holds together. With a little practice, Tableau calculations stop feeling unpredictable, and LOD expressions become one of the cleanest ways to control exactly what your analysis is measuring.
Work With Table Calculations
Now that we have moved past the logic of where a calculation lives, we can step into the moment where Tableau starts working with the finished picture. That is where table calculations come in: they transform the values already shown in the visualization, and Tableau uses them for things like rankings, running totals, and percent of total. If you have ever wondered, “What is a table calculation in Tableau when the chart is already built?”, that is the answer we are about to unpack.
The easiest way to picture this is to think of the worksheet as a map that Tableau has already drawn. A table calculation does not redraw the map from raw data; it reads the map that is already on the page. Tableau builds a virtual table from the dimensions in the view, and the calculation works on what is currently visible there, which is why rearranging fields or changing the view can change the result. That is also why table calculations do not consider measures or dimensions that have been filtered out of the visualization.
Once that idea clicks, the next piece becomes much less mysterious: Compute Using. This setting tells Tableau the direction and scope of the calculation relative to the visual structure, and Tableau automatically treats some dimensions as addressing fields and others as partitioning fields based on your selection. In plain language, the partitioning fields define the group the calculation lives inside, while the addressing fields define the path it follows across that group. It feels a little technical at first, but the mental model is simple: one part says where the calculation starts, and the other part says how it moves.
That is why table calculations are such a natural fit for questions like percent of total, rank, and running total. Tableau’s own guidance says that if you already have all the values you need in the visualization, a table calculation is a good choice; if you do not, you usually need a different kind of calculation. So when you are building a view and asking yourself whether the answer should be read from the finished chart or computed earlier in the pipeline, you are really deciding whether table calculations belong in the story.
A practical habit makes this much easier: build the view first, then test the calculation against the layout you created. If the number shifts when you move a field between rows, columns, or marks, that is usually a sign that the view structure changed the calculation’s path. Tableau lets you right-click the field and edit the table calculation, change Compute Using, adjust the relative position for difference-style calculations, or clear the table calculation entirely. That edit-and-check loop is not a detour; it is how Tableau table calculations reveal what they are really doing.
As you get used to it, this part of Tableau starts to feel less like code and more like choreography. You set the stage, Tableau reads the stage, and then the calculation moves across the marks in the order you chose. That is the key habit to carry forward: when a result looks odd, do not only inspect the formula; inspect the view, the Compute Using setting, and the level of detail the worksheet is showing. With that habit, table calculations become a reliable finishing tool instead of a source of guesswork.
Combine Nested Calculations
Now that we’ve seen how Tableau calculations can live at different layers, the next step is learning how those layers can work together. Nested calculations are what happen when one Tableau calculation becomes the input for another, and that is where advanced analysis starts to feel less like isolated formulas and more like building with stacked transparent blocks. If you’ve ever wondered, how do you combine nested calculations in Tableau without losing track of what’s happening where? the answer is to slow down and treat each layer as a separate decision. In Tableau calculations, the order matters just as much as the formula itself.
The easiest way to picture this is to think about cooking in stages. First, you chop and season the ingredients, then you cook them, and finally you plate the dish. Nested calculations follow the same rhythm: one calculation prepares the data, another summarizes it, and a final one shapes how the result appears in the view. That is why a nested Tableau calculation can feel powerful rather than confusing when you name each stage in your head, even before you write the formula.
A common pattern is to let a lower-level calculation create a clean building block, then reuse that block in a higher-level result. For example, you might use a row-level calculation to flag a specific condition, then wrap that result inside an aggregate calculation like SUM() or AVG() to compare groups. You can also place a level of detail expression inside a larger expression when you need one grain of data for the logic and another grain for the display. This is one of the most useful ways to combine nested calculations in Tableau because it lets you separate “what the data means” from “how the worksheet shows it.”
Here is where many Power BI users feel the shift most strongly. In Power BI, you may be used to measures handling a lot of the lifting inside a single model-driven layer, but Tableau often asks you to be more explicit about each step. That means nested Tableau calculations are less about cramming everything into one formula and more about arranging the logic in the right order. When the result looks wrong, the issue is often not the math itself; it is that one layer is asking for data at a grain that another layer has not yet produced.
A practical example helps make that real. Suppose you want to find the average customer sales in each region, but only after calculating sales at the customer level first. You can build a level of detail expression that fixes the value at the customer grain, then place that result into an aggregate calculation in the view. The inner calculation preserves the customer-level meaning, while the outer calculation lets the worksheet summarize it by region. That is the heart of nested calculations in Tableau: one layer protects the detail, and the next layer tells the story.
The same logic applies when you combine table calculations with other formulas. A table calculation works on the result that already appears in the view, so it often sits at the outer edge of a nested structure. You might first create a fixed baseline with an LOD expression, then rank or compare that baseline with a table calculation. In plain language, Tableau first decides what the numbers are, and then it decides how they should move across the finished chart. That is why nested calculations can produce elegant results, but also why the view structure has to stay aligned with the formula.
The safest way to work with these layers is to build them one at a time. Start with the inner calculation, place it in the view, and check that it returns the meaning you expect before you wrap anything around it. Then add the outer calculation and ask whether it changes the answer in a helpful way or accidentally changes the level of detail. This step-by-step habit keeps Tableau calculations readable and makes debugging much less painful, especially when you are combining nested calculations for the first time.
As you practice, you will notice that nesting is less about memorizing syntax and more about learning to guide the data through a sequence of choices. First we define the grain, then we summarize, then we refine the view. That small rhythm is what makes advanced Tableau work feel stable instead of chaotic, and it gives you a clear path for building more complex analysis without losing the thread.
Debug and Optimize Results
When a Tableau result looks wrong, the fastest path forward is rarely to rewrite everything at once. It helps to treat debugging Tableau calculations like following a trail of breadcrumbs: we start with the raw row, move through aggregation, and then check what the view is doing on top of that. That mindset matters because a number can look “incorrect” for several different reasons, and each layer tells a different part of the story. Once we learn to separate those layers, the work shifts from guessing to investigating.
A good first move is to isolate the calculation and make it small enough to question. If a formula includes a row-level calculation, an aggregate, and a table calculation, test each piece on its own before combining them again. This is a little like checking a recipe one step at a time instead of tasting the finished dish and trying to guess which ingredient went wrong. When you ask, “Why does my Tableau calculation change when I add a filter?”, you are usually seeing the view, the filters, or the level of detail influence the answer more than the formula itself.
The next clue is the grain, which is the level of detail your data is answering at. If you expect a customer-level answer but the worksheet is showing months or regions, Tableau may be summarizing in a way that hides the logic you meant to see. This is especially important with LOD expressions, because a FIXED calculation can stay anchored to specific dimensions while the view keeps changing around it. Filters matter here too, because a FIXED LOD expression ignores most worksheet filters unless they are context filters, data source filters, or extract filters, so a filter placed in the wrong spot can make the result feel mysterious.
That is why a tiny test worksheet is one of the best debugging tools you have. Build a clean view with one or two dimensions, place the calculation there, and watch how the number behaves as you add fields back in. If the result changes when you move a field from Rows to Columns, or when you swap a discrete field for a continuous one, Tableau is telling you that the structure of the view is part of the calculation. In practice, this kind of worksheet acts like a flashlight: it shows exactly where the logic starts to drift.
Once the numbers are correct, the next job is to optimize Tableau calculations so the workbook stays fast and easy to trust. A simple rule helps here: use the lightest calculation that can answer the question. If a row-level calculation can do the job, do not reach for a table calculation; if an LOD expression gives you the right grain cleanly, do not wrap extra layers around it unless they add real value. Repeated nesting can make a workbook harder to read and slower to render, especially when the same logic appears in several places.
Performance also improves when we reduce unnecessary work in the view itself. A sheet with lots of unique values, many marks, or extra dimensions can make Tableau calculate more than you actually need. That is why it often helps to remove fields that do not change the answer, shorten the path for table calculations, and keep filters where they do the most good. In other words, debugging Tableau calculations is about correctness first, but optimization is about making the correct answer arrive with less friction.
There is also a readability gain hidden inside good optimization. When you name calculations clearly, test them in stages, and keep the worksheet layout aligned with the logic, future you will spend less time hunting through formulas and more time interpreting the result. The best Tableau calculation work feels calm because every layer has a reason to exist. When that happens, the workbook stops behaving like a puzzle and starts behaving like a reliable conversation with the data.